
- Democracy in Action « Campaign Literature Archive Main Page « 2010 Governor Races
| Nov. 2,
2010 Governor Races |
|
After
Nov. 2: 29R, 20D, 1I.
*Does not include Guam, USVI and CNMI. |


| 25.01
+ |
20.01-25.0 |
15.01-20.0 |
10.01-15.0 |
5.01-10.0 |
0-5.0 |
0-5.0 |
5.01-10.0 |
10.01-15.0 |
15.01-20.0 |
20.01-25.0 |
25.01
+ |
| NY 29.26 AR 30.79 |
HI 17.10* |
CA 12.88* MD 14.46 CO 14.67 |
MA 6.42 NH 7.61 |
MN 0.42* CT 0.56* IL 0.85 OR 1.53 VT 1.79* |
FL 1.15* ME 1.71* OH 2.00* SC 4.46 |
WI 5.77* NM 6.74* PA 8.97* IA 9.60* |
GA
10.05 NV 11.75 AZ 11.86 TX 12.67 |
AL
15.71 MI 18.21* |
OK 20.90* AK 21.38 SD 23.03 |
ID 26.25 KS 31.07* TN 31.95* UT 32.16 WY 42.74 NE 47.80 |
AND
Rhode Island: Independent Chafee won with plurality of 2.53* percentage points.
*Seat changed parties.
*Seat changed parties.
|
2010
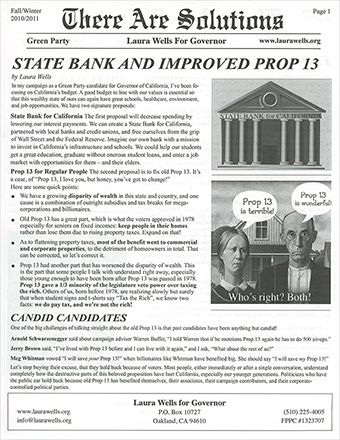
GOVERNOR RACE OVERVIEW [links/logos]
All forecasts saw a difficult cycle for Democrats. The November 2009 off-year elections set the stage, as Republicans won the governorships at stake in New Jersey and Virginia. The near collapse of the economy in 2008 and the slow recovery created a difficult electoral environment for governors around the country. Jobs was the top issue; many candidates produced detailed jobs plans. Most states were grappling with budget shortfalls, necessitating difficult policy decisions. Additionally, Republicans were able to feed off of the energy generated by Tea Party activists, while Democrats, after successful cycles in 2006 and 2008, suffered from an "enthusiasm gap." A further key factor in 2010 gubernatorial races was the large number of open seats. Of 37 seats at stake, there were 24 open seats—15 term limited, 8 retiring and 1 defeated in primary—compared to four years earlier in 2006 when 36 seats were up but only nine governors were term limited or retiring. Amid very significant turnover, the net result was a big setback for Democrats (>). Following the Nov. 2, 2010 elections, the balance went from 26 Democrats and 24 Republicans to 29 Republicans, 20 Democrats and 1 Independent. Republicans flipped 12 seats and Democrats 5 (>) and 1 Independent took a seat that had been held by a Republican. Of the 26 new governors* who took office in Dec. 2010 and Jan. 2011, 17 were Republicans, 8 Democrats and 1 Independent. Balance before Nov. 2 was 26 Democrats, 24 Republicans. 37 seats at stake: 19 held by Democrats and 18 by Republicans. 24 open seats of which12 held by Democrats and 12 by Republicans. 15 Governors were term limited, 8 retiring and 1 defeated in primary. Of 13 sitting Governors seeking re-election or election on Nov. 2, 11 succeeded. 26 new* Governors were elected: 17 Republicans, 8 Democrats and 1 Independent. Republicans won 23 seats, Democrats 13 seats and Independent 1 seat. Balance after Nov. 2 was 29 Republicans, 20 Democrats and 1 Independent. *Three had served previously. |
||
|
HIGHLIGHTS
|
||
see also: campaign managers |
2022 | 2021 | 2020 | 2019 | 2018 | 2017 | 2016 | 2015 | 2014 | 2013 | 2012 | 2011
ADVERTISEMENT
Copyright © 2023 Eric M. Appleman/Democracy in
Action. All rights reserved.![]()