| 1988 |
|
Democrats |
Republicans |
Third
Party/Independent
|
Nov.
8, 1988 President
+Bush/Quayle
(R)
|
5,054,917
|
51.13%
|
Dukakis/Bentsen
(R)
|
4,702,233
|
47.56%
|
Paul/Marrou
(L)
|
70,105
|
0.71%
|
Lenora
Fulani (I)
|
31,181
|
0.32%
|
James C.
Griffin (AIP)
|
27,818
|
0.28%
|
write-ins
(4)
|
811
|
-
|
|
9,887,065
|
|
|
|
|
Plurality: 352,684 votes
3.57 percentage
points |
|
| |
|
|
|
|
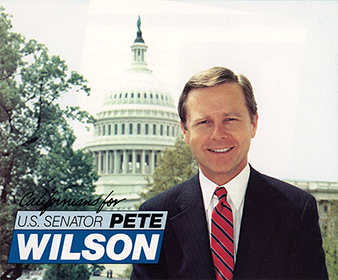
Nov. 8, 1988 U.S. Senate
+Pete
Wilson (R) i
|
5,143,409
|
52.79%
|
Leo
McCarthy (D)
|
4,287,253
|
44.00%
|
| M.
Elizabeth Muñoz (P&F) |
166,600
|
1.71%
|
| Jack Dean
(L) |
79,997
|
0.82%
|
Merton D.
Short (AIP)
|
66,288
|
0.68%
|
write-ins
|
51
|
|
|
9,743,598
|
|
Plurality: 856,156 votes
8.79 percentage
points
|
|
 |
 |
|
| 1986 |
|
|
|
|
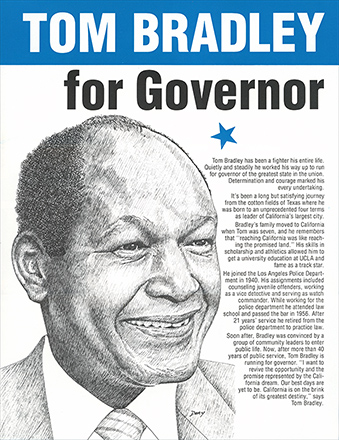
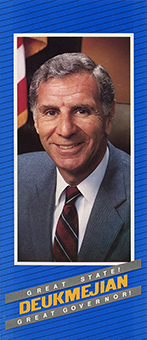
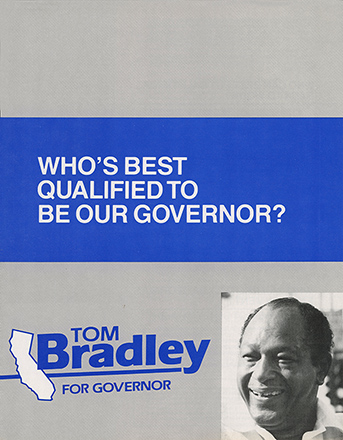
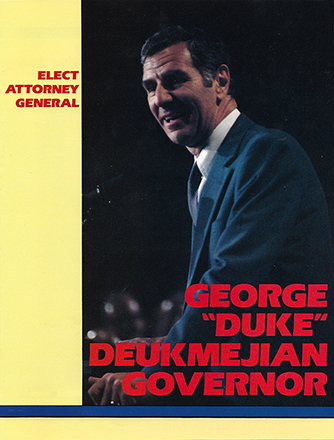
Nov.
4, 1986 Governor
+George Deukmejian (R) i
|
4,505,601
|
60.54%
|
Tom
Bradley (D)
|
2,781,714
|
37.38%
|
Joseph
Fuhrig (L)
|
52,628
|
0.71%
|
| M.
Elizabeth Muñoz (P&F) |
51,995
|
0.70%
|
Gary V.
Miller (AIP)
|
50,547
|
0.68%
|
|
7,442,485
|
|
Plurality: 1,723,887 votes
23.16 percentage
points
|
|
 |
 |
|
| |
|
|
|
|
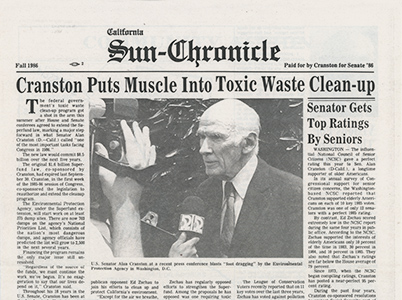
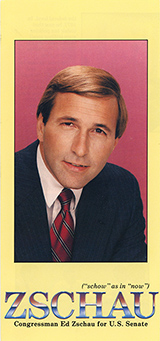
Nov.
4, 1986 U.S. Senate
+Alan
Cranston (D) i
|
3,646,672
|
49.29%
|
| Ed Zschau (R) |
3,541,804
|
47.87%
|
Edward B.
Vallen (AIP)
|
109,916
|
1.49%
|
Breck
McKinley (L)
|
66,261
|
0.90%
|
Paul
Kangas (P&F)
|
33,869
|
0.46%
|
write-ins
|
27
|
|
|
7,398,549
|
|
Plurality: 104,868 votes
1.42 percentage
points |
|
 |
 |
|
| 1984
|
|
|
|
|
Nov 6, 1984
President
+Reagan/Bush
(R)
|
5,467,009
|
57.51%
|
Mondale/Ferraro
(D)
|
3,922,519
|
41.27%
|
| Bergland/Lewis (L) |
115,513
|
1.22%
|
| Bob Richards (AIP) |
39,265
|
0.41%
|
| Sonia Johnson (P&F) |
26,297
|
0.29%
|
| write-ins |
382
|
|
|
9,505,423 |
|
|
|
|
Plurality: 1,544,490 votes
16.25 percentage
points |
|
| 1982
|
|
|
|
|
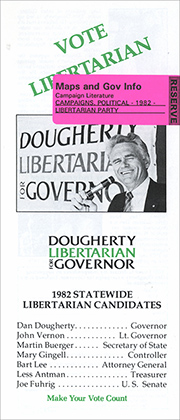
Nov.
2, 1982 Governor R+
+George
Deukmejian (R)
|
3,881,014
|
49.28%
|
Tom
Bradley (D)
|
3,787,669
|
48.09%
|
Dan P.
Dougherty (L)
|
81,076
|
1.03%
|
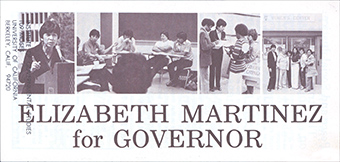
Elizabeth Martinez
(P&F)
|
70,327
|
0.89%
|
James C.
Griffin (AIP)
|
56,249
|
0.71%
|
|
7,876,335
|
|
Plurality: 93,345 votes
1.19 percentage
points
|
|
 |
 |
  |
|
|
|
|
|
Nov.
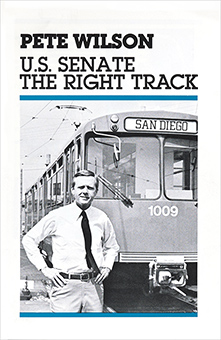
2, 1982 U.S. Senate
+Pete
Wilson (R)
|
4,022,565
|
51.53%
|
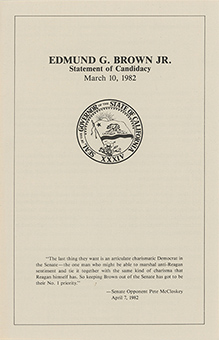
| Jerry Brown (D) |
3,494,968
|
44.78%
|
Joseph
Fuhrig (L)
|
107,720
|
1.38%
|
David
Wald (P&F)
|
96,388
|
1.23%
|
Theresa
Dietrich (AIP)
|
83,809
|
1.07%
|
write-ins
|
88
|
-
|
|
7,805,538
|
|
Plurality: 527,597 votes
6.76 percentage points
|
|
|
 |
|
| 1980
|
|
|
|
|
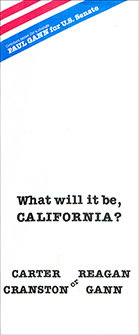
Nov. 4, 1980
President
+Reagan/Bush
(R)
|
4,524,858
|
52.69%
|
Carter/Mondale
(D)
|
3,083,661
|
35.91%
|
Anderson/Lucey (I)
|
739,833
|
8.62%
|
| Clark/Koch
(L) |
148,434 |
1.73% |
Commoner/Harris
(I)
|
61,063
|
0.71% |
Maureen
Smith (P&F)
|
18,116
|
0.21%
|
John
Rarick (AIP)
|
9,856
|
0.11% |
write-ins (6)
|
1,239
|
0.01%
|
|
8,587,063 |
|
|
|
|
Plurality: 1,441,197
votes
16.78 percentage points
|
|
|
|
|
|
|
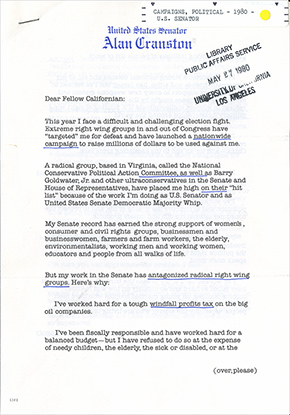
Nov. 4, 1980 U.S.
Senate
+Alan Cranston (D) i
|
4,705,399 |
56.5%
|
Paul Gann (R)
|
3,093,426 |
37.2%
|
David
Bergland (L)
|
202,481
|
2.4%
|
David
Wald (P&F)
|
196,354
|
2.4%
|
James C.
Griffin (AIP)
|
129,648
|
1.6%
|
|
|
|
Plurality: 1,611,973 votes
19.3 percentage points
|
|
|
 |
|
| 1978
|
|
|
|
|
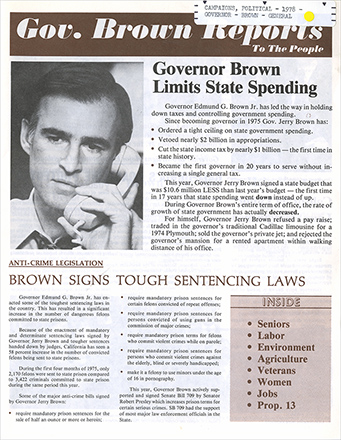
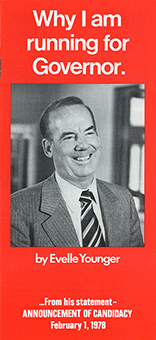
Nov.
7, 1978 Governor
+Jerry Brown (D) i
|
3,878,812 |
56.05%
|
Evelle J. Younger (R)
|
2,526,534 |
36.50%
|
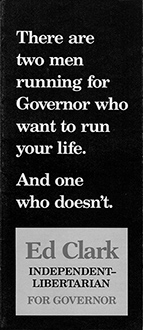
Ed Clark
(I)
|
377,960
|
5.46%
|
Marilyn
Seals (P&F)
|
70,864
|
1.02%
|
Therese
Dietrich (AIP)
|
67,103
|
0.97%
|
|
6,921,273
|
|
Plurality: 1,352,278 votes
19.54 percentage points
|
|
 |
 |
 |
| 1976
|
|
|
|
|
Nov. 2, 1976
President
| +Ford/Dole
(R)
|
3,882,244
|
49.35%
|
Carter/Mondale
(D)
|
3,742,284
|
47.57%
|
| Eugene McCarthy(w/in) |
58,417
|
0.74%
|
| MacBride/Bergland (I) |
56,388
|
0.72%
|
Lester Maddox (AIP)
|
52,098
|
0.65%
|
| Margaret Wright (P&F) |
41,731
|
0.53%
|
Peter
Camejo (I)
|
17,259
|
0.22%
|
Gus Hall
(I)
|
12,766
|
0.16%
|
| write-ins (6) |
4,935
|
0.06%
|
|
7,867,117
|
|
|
|
Plurality: 139,960 votes
1.78
percentage points |
|
|
|
|
|
|
|
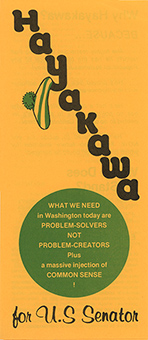
Nov.
2, 1976 U.S. Senate R+
| +S.I.
Hayakawa (R)
|
3,748,973
|
50.12%
|
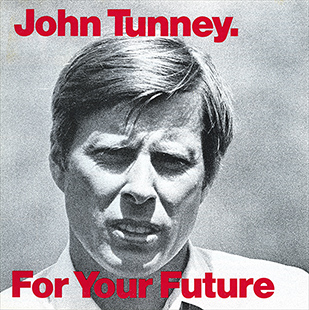
John
Tunney (R) i
|
3,502,862
|
46.89%
|
David
Wald (P&F)
|
104,383
|
1.40%
|
Jack
McCoy (AIP)
|
82,739
|
1.11%
|
Omari
Musa (I)
|
32,639
|
0.42%
|
|
7,470,586 |
|
Plurality:
246,111 votes
3.23 percentage
points
|
|
 |
 |
(write in)
|
|
|
|
|
|
|