| 2022 |
|
Democrats |
Republicans |
Third
Party/
Independent
|
Nov. 8,
2022 Governor D+
+Katie Hobbs (D)
|
1,287,891
|
50.32%
|
| Kari Lake (R)
|
1,270,774 |
49.65%
|
| write-ins
(7) |
820
|
0.03%
|
|
2,559,485
|
|
Plurality: 17,117 votes
0.67 percentage points
|
|
 |
 |
|
| |
|
|
|
|
Nov. 8,
2022 U.S. Senate
+Mark Kelly (D) i
|
1,322,027
|
51.39%
|
| Blake Masters (R) |
1,196,308 |
46.51%
|
Marc
Victor (L)
|
53,762
|
2.09%
|
| write-ins
(8) |
197
|
<0.01%
|
|
2,572,294
|
|
Plurality: 125,719 votes
4.89 percentage points
|
|
 |
 |
|
| 2020 |
|
|
|
|
Nov
3, 2020 President
| +Biden/Harris
(D) |
1,672,143 |
49.36% |
Trump/Pence (R)
|
1,661,686
|
49.06%
|
Jorgensen/Cohen
(L)
|
51,463
|
1.52%
|
write-ins
(5)
|
2,032
|
0.06%
|
|
3,387,324
|
|
|
|
Plurality: 10,457
votes
0.30 percentage
points
|
|
|
|
|
|
|
|
Nov. 3,
2020 U.S. Senate (special)
D+
+Mark Kelly (D)
|
1,716,467
|
51.16%
|
| Martha McSally (R) i
|
1,637,661 |
48.81%
|
| write-ins
(10) |
1,189
|
0.04%
|
|
3,355,317
|
|
Plurality: 78,806 votes
2.35 percentage points
|
|
 |
 |
|
| 2018
|
|
|
|
|
Nov.
6, 2018 Governor
+Doug
Ducey (R) i
|
1,330,863
|
56.00%
|
David
Garcia (D)
|
994,341
|
41.84%
|
Angel
Torres (G)
|
50,962
|
2.14%
|
write-ins
(5)
|
275
|
|
|
2,376,440
|
|
Plurality: 336,522 votes
14.16 percentage
points
|
|
 |
 |
 |
|
|
|
|
|
Nov.
6, 2018 U.S. Senate D+
+Kyrsten Sinema (D)
|
1,191,100
|
49.96%
|
Martha McSally (R)
|
1,135,200
|
47.61%
|
| Angela
Green (G) |
57,422
|
2.41%
|
write-ins (7)
|
566
|
|
|
2,384,288
|
|
Plurality: 55,900 votes
2.34 percentage
points
|
|
 |
 |
|
| 2016
|
|
|
|
|
Nov.
8, 2016
President
| +Trump/Pence
(R) |
1,252,401 |
48.67% |
Clinton/Kaine (D)
|
1,161,167
|
45.13%
|
Johnson/Weld (L)
|
106,327
|
4.13%
|
Stein/Baraka
(G)
|
34,345
|
1.33%
|
| Evan McMullin (w/in)
|
17,449
|
0.68%
|
Darrell
Castle (w/in)
|
1,058
|
0.04%
|
more
write-ins (14)
|
418
|
0.02%
|
|
2,573,165
|
|
|
|
|
Plurality: 91,234 votes
3.54 percentage points
|
|
|
|
|
|
|
Nov.
8, 2016 U.S. Senate
+John McCain (R) i
|
|
53.71%
|
Ann Kirkpatrick (D)
|
|
40.75%
|
Gary Swing (G)
|
|
5.48%
|
write-ins
(8)
|
1,584
|
0.06%
|
|
2,530,730
|
|
Plurality: 328,022 votes
12.96 percentage points
|
|
 |
 |
|
| 2014
|
|
|
|
|
Nov.
4, 2014 Governor
+Doug Ducey (R)
|
805,062
|
53.44%
|
| Fred DuVal (D)
|
626,921 |
41.62%
|
| Barry
J.
Hess
(L) |
57,337
|
3.81%
|
| John
Lewis
Mealer
(AEL) |
15,432
|
1.02%
|
| write-ins
(6) |
1,664
|
0.11%
|
|
1,506,416
|
|
Plurality: 178,141 votes
11.83 percentage
points
|
|
 |
 |
|
| 2012
|
|
|
|
|
Nov.
6, 2012 President
+Romney/Ryan (R)
|
1,233,654
|
53.65%
|
| Obama/Biden (D)
|
1,025,232 |
44.59%
|
| Johnson/Gray
(L) |
32,100
|
1.40%
|
| Stein/Honkala
(G) |
7,816
|
0.34%
|
| write-ins
(6) |
452
|
|
|
2,299,254
|
|
|
|
|
Plurality: 208,422 votes
9.06 percentage points
|
|
|
|
|
|
|
Nov.
6, 2012 U.S. Senate
+Jeff Flake (R)
|
1,104,457
|
49.23%
|
| Richard Carmona (D)
|
1,036,542 |
46.20%
|
| Marc
Victor (L) |
102,109
|
4.55%
|
| write-ins
(2) |
314
|
|
|
2,243,422
|
|
Plurality: 67,915 votes
3.03 percentage
points
|
|
 |
 |
|
| 2010 |
|
|
|
|
Nov.
2, 2010 Governor
| +Jan
Brewer
(R) i
|
938,934
|
54.33%
|
Terry
Goddard (D)
|
733,935
|
42.47%
|
Barry J.
Hess (L)
|
38,722
|
2.24%
|
Larry
Gist (G)
|
16,128
|
0.93%
|
| write-ins |
362
|
|
|
1,728,081
|
|
Plurality:
204,999 votes
11.86 percentage points |
|
 |
 |
|
|
|
|
|
|
Nov.
2, 2010 U.S. Senate
| +John
McCain (R) i
|
1,005,615
|
58.86%
|
Rodney
Glassman (D)
|
592,011
|
34.65%
|
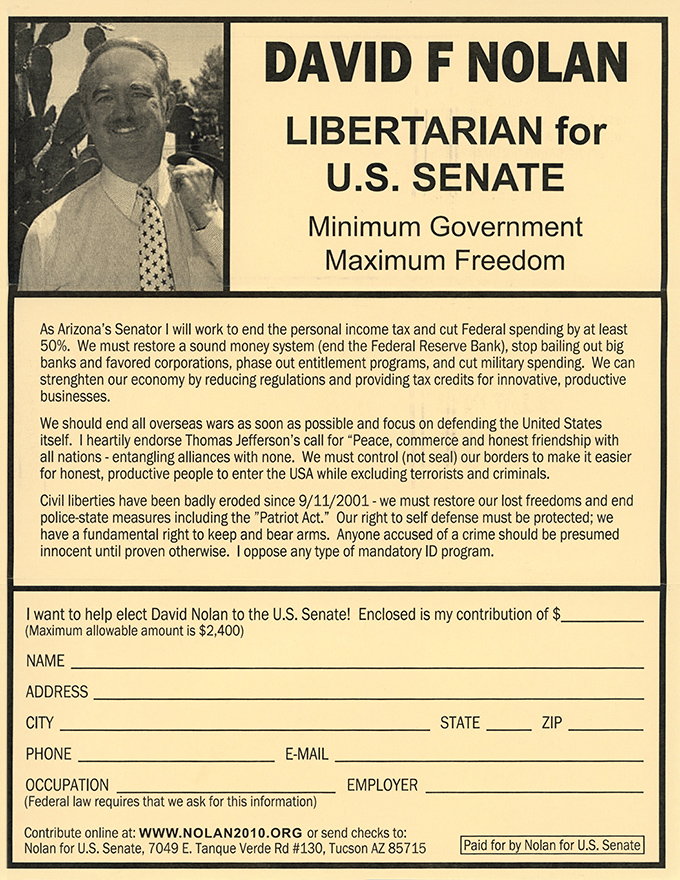
David
Nolan (L)
|
80,097
|
4.69%
|
Jerry
Joslyn (G)
|
24,603
|
1.44%
|
write-ins
(5)
|
6,058
|
0.35%
|
;
|
1,708,384
|
|
Plurality:
413,604 votes
24.21 percentage points
|
|
 |
 |
 |
|