2022
|
|
Democrats |
Republicans |
Third
Party/
Independent
|
Nov.
8, 2022 Governor D+
+Wes Moore/
Aruna Miller (D)
|
1,293,944
|
64.53%
|
Dan Cox/
Gordana Schifanelli (R)
|
644,000
|
32.12%
|
David Lashar/
Christiana Logansmith (L)
|
30,101
|
1.50%
|
David
Harding/
Cathy White (WCP)
|
17,154
|
0.86%
|
Nancy
Wallace/
Patrick Elder (G)
|
14,580
|
0.73%
|
write-ins
|
5,444
|
0.27%
|
|
2,005,223
|
|
Plurality: 649,944 votes
32.41 percentage
points
|
|
 |
 |
   |
|
|
|
|
|
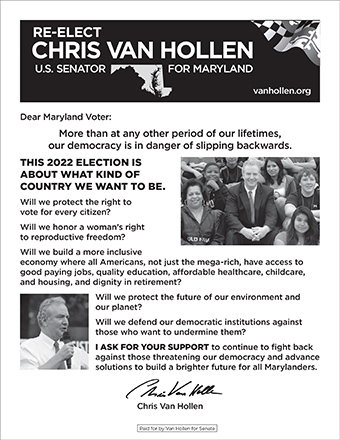
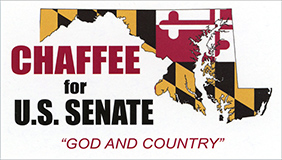
Nov.
8, 2022 U.S. Senate
+Chris Van Hollen (D) i
|
1,316,897
|
65.77%
|
Chris Chaffee (R)
|
682,293
|
34.96%
|
write-ins
|
3,146
|
0,15%
|
|
2,002,336
|
|
Plurality: 634,604 votes
31.69 percentage
points
|
|
 |
 |
|
2020
|
|
|
|
|
Nov
3, 2020 President
| +Biden/Harris
(D) |
1,985,023 |
65.36%
|
Trump/Pence (R)
|
976,414
|
32.15%
|
Jorgensen/Cohen
(L)
|
33,488
|
1.10%
|
Hawkins/Walker
(G)
|
15,799
|
0.52%
|
Segal/de
Graaf (B&R)
|
5,884
|
0.19%
|
write-ins
|
20,422
|
0.67%
|
|
3,037,030
|
|
|
|
Plurality:
1,008,609 votes
33.21 percentage points
|
|
|
| 2018
|
|
|
|
|
Nov. 6,
2018 Governor
+Larry Hogan/
Boyd Rutherford (R) i
|
1,275,644
|
55.35%
|
Ben Jealous/
Susie Turnbull (D)
|
1,002,693
|
43.51%
|
Shawn Quinn/
Christina Smith (L)
|
13,241
|
0.57%
|
Ian
Schlakman/
Annie Chambers (G)
|
11,175
|
0.48%
|
write-ins
|
1,813
|
0.08%
|
|
2,304,512
|
|
Plurality: 272,051 votes
11.84 percentage
points
|
|
 |
 |
|
|
|
|
|
|
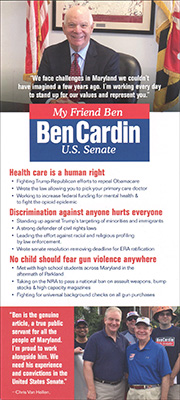
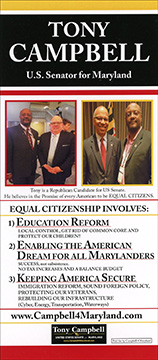
Nov.
6, 2018 U.S. Senate
+Ben Cardin (D) i
|
1,491,614
|
64.86%
|
Tony Campbell (R)
|
697,017
|
30.31%
|
Neal Simon (I)
|
85,964
|
3.74%
|
Arvin Vohra
(L)
|
22,943
|
1.00%
|
write-ins
|
2,327
|
0.10%
|
|
2,299,865
|
|
Plurality: 794,597 votes
34.55 percentage
points
|
|
 |
 |
 |
| 2016
|
|
|
|
|
Nov.
8, 2016 President
| +Clinton/Kaine (D)
|
1,677,928
|
60.33%
|
| Trump/Pence (R) |
943,169
|
33.91%
|
Johnson/Weld
(L)
|
79,605
|
2.86%
|
Stein/Baraka
(G)
|
35,945
|
1.29%
|
write-ins
|
44,529
|
1.62%
|
|
2,781,446 |
|
write-in includes 9,630 votes
for Evan McMullin |
|
Plurality: 734,759 votes
26.42 percentage
points
|
|
|
|
|
|
|
|
Nov.
8, 2016 U.S. Senate
+Chris Van Hollen (D)
|
1,659,907 |
60.89% |
Kathy Szeliga (R)
|
972,557 |
35.67%
|
| Margaret
Flowers (G) |
89,970
|
3.30%
|
| write-ins |
3,736
|
0.14%
|
|
2,726,170
|
|
Plurality: 687,350 votes
25.22 percentage
points
|
|
 |
 |
 |
| 2014
|
|
|
|
|
Nov.
4, 2014 Governor R+
+Larry Hogan/
Boyd Rutherford (R)
|
884,400
|
51.03%
|
Anthony Brown/
Ken Ulman (D)
|
818,890
|
47.25%
|
Shawn Quinn/
Lorenzo Gaztañaga
(L)
|
25,382
|
1.46%
|
write-ins
|
4,505
|
0.26%
|
|
1,733,177
|
|
Plurality: 65,510 votes
3.64 percentage points
|
|
 |
 |
 |
| 2012
|
|
|
|
|
Nov.
6, 2012 President
+Obama/Biden (D)
|
1,677,844
|
61.97%
|
Romney/Ryan (R)
|
971,869
|
35.90%
|
Johnson/Gray (L)
|
30,195
|
1.12%
|
Stein/Honkala
(G)
|
17,110
|
0.63%
|
write-ins
|
10,309
|
0.38%
|
|
2,707,327
|
|
|
|
Plurality: 705,975 votes
26.07
percentage points |
|
|
|
|
|
|
|
Nov.
6, 2012 U.S. Senate
+Ben Cardin (D) i
|
1,474,028
|
55.98%
|
Dan Bongino (R)
|
693,291
|
26.33%
|
Rob Sobhani (Unaff.)
|
430,934
|
16.37%
|
Dean
Ahmad (L)
|
32,252
|
1.22%
|
write-ins
|
2,729
|
0.10%
|
|
2,633,234
|
|
Plurality: 780,737 votes
29.65 percentage
points
|
|
 |
 |
 |
| 2010
|
|
|
|
|
Nov. 2, 2010 Governor
+Martin O'Malley/
Anthony Brown (D) i
|
1,044,961
|
56.24%
|
Bob Ehrlich/
Mary Kane (R)
|
776,319
|
41.79%
|
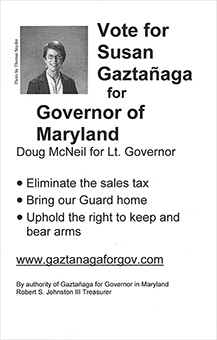
Susan Gaztañaga/
Doug McNeil (L)
|
14,137
|
0.76%
|
Maria Allwine/
Ken Eidel (G) |
11,825
|
0.64%
|
Eric Delano Knowles/
M.Hargadon (C) |
8,612
|
0.46%
|
| write-ins |
2,026
|
0.11%
|
|
1,857,880
|
|
Plurality: 268,642 votes
14.46
percentage points
|
|
|
 |
 |
|
|
|
|
|
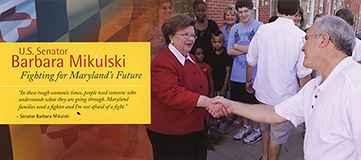
Nov. 2, 2010 U.S.
Senate
+Barbara Mikulski (D) i
|
1,140,531
|
62.19%
|
Eric Wargotz (R)
|
655,666
|
35.75%
|
Kenniss Henry (G)
|
20,717
|
1.13%
|
Richard
Shawver (C)
|
14,746
|
0.80%
|
write-ins
|
2,198
|
0.12%
|
|
1,833,541
|
|
Plurality: 484,865 votes
26.44 percentage
points
|
|
 |
 |
|
|