|
2022 |
|
Democrats |
Republicans |
Third
Party/
Independent
|
Nov.
8, 2022 Governor
+Tony Evers/
Sara Rodriguez (D) i
|
1,358,774
|
51.15%
|
Tim Michels/
Roger Roth(R)
|
1,268,535
|
47.75%
|
Joan Ellis Beglinger (I)
|
27,198
|
1.02%
|
write-in
and scattering
|
1,983
|
0.07%
|
|
2,656,490 |
|
Plurality: 90,239 votes
3.40 percentage points
|
|
 |
 |
|
|
|
|
|
|
Nov.
8, 2022 U.S. Senate
+Ron Johnson (R) i
|
1,337,185
|
50.41%
|
Mandela Barnes (D)
|
1,310,467
|
49.41%
|
write-in and scattering
|
4,825
|
0.18%
|
|
2,652,477 |
|
Plurality: 26,718 votes
1.01 percentage
points
|
|

|
 |
|
|
2020 |
|
|
|
|
Nov
3, 2020 President
(post-recount)
|
|
|
+Biden/Harris
(D)
|
1,630,866
|
49.45%
|
Trump/Pence
(R)
|
1,610,184
|
48.82%
|
| Jorgensen/Cohen (L) |
38,491 |
1.17%
|
| Carroll/Patel (ASP) |
5,259 |
0.16%
|
Blankenship/Mohr
(C)
|
5,146
|
0.16%
|
write-ins
(7)
|
1,728
|
0.05%
|
scattering
|
6,367
|
0.19%
|
|
3,298,041
|
|
|
|
Plurality:
20,682 votes
0.63 percentage points
|
|
|
| 2018
|
|
|
|
|
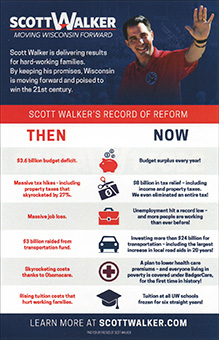
Nov. 6,
2018 Governor D+
+Tony
Evers/
Mandela Barnes (D)
|
1,324,307
|
49.54%
|
Scott
Walker/
Rebecca Kleefisch (R) i
|
1,295,080
|
48.44%
|
Phillip
Anderson/
Patrick Baird (L)
|
20,225
|
0.76%
|
Maggie
Turnbull/
Will Losch (I)
|
18,884
|
0.71%
|
Michael J.
White/
Tiffany Anderson (I)
|
11,087
|
0.41%
|
Arnie
Enz (I)
|
2,745
|
0.1%
|
write-ins
|
14
|
|
scattering
|
966
|
0.04%
|
|
2,673,308
|
|
Plurality: 29,227 votes
1.10 percentage points
|
|
 |
 |
|
|
|
|
|
|
Nov.
6, 2018 U.S. Senate
+Tammy Baldwin (D) i
|
1,472,914
|
55.36%
|
Leah Vukmir (R)
|
1,184,885
|
44.53%
|
write-ins
|
42
|
|
scattering
|
2.922
|
0.11%
|
|
2,660,763 |
|
Plurality: 288,029 votes
10.83 percentage points
|
|
 |
 |
|
| 2016
|
|
|
|
|
Nov.
8, 2016 President
(post-recount)
|
|
|
+Trump/Pence
(R)
|
1,405,284
|
47.22%
|
Clinton/Kaine
(D)
|
1,382,536 |
46.45% |
Johnson/Weld
(L)
|
106,674
|
3.58%
|
Stein/Baraka
(G)
|
31,072
|
1.04%
|
Castle/Bradley
(C)
|
12,162
|
0.41%
|
McMullin/Johnson
(w/in)
|
11,855
|
0.40%
|
Moorehead/Lilly
(I)
|
1,770
|
0.06%
|
De La Fuente/Steinberg(I)
|
1,502
|
0.05%
|
more
write-ins (8)
|
531
|
|
scattering
|
22,764
|
0.76%
|
|
2,976,150 |
|
|
|
|
Plurality:
22,748 votes
0.74 percentage points
|
|
|
|
|
|
|
Nov.
8, 2016 U.S. Senate
+Ron Johnson (R) i
|
|
50.17% |
Russ Feingold (D)
|
|
46.81%
|
Phil
Anderson (L)
|
87,531 |
2.97%
|
John
Schiess (w/in)
|
8
|
|
scattering
|
1,396
|
|
|
2,948,741
|
|
Plurality: 99,136 votes
3.36 percentage
points
|
|
 |
 |
|
| 2014
|
|
|
|
|
Nov.
4, 2014 Governor
+Scott Walker/
Rebecca Kleefisch (R) i
|
1,259,706
|
52.26%
|
Mary
Burke/
John Lehman (D)
|
1,122,913
|
46.59%
|
Robert
Burke/
Joseph M. Brost (I)
|
18,720
|
0.78%
|
Dennis Fehr
(I)
|
7,530
|
0.31%
|
write-ins
|
197
|
|
scattering
|
1,248
|
0.05%
|
|
2,410,314
|
|
Plurality: 136,793 votes
5.68 percentage points
|
|
 |
 |
|
| 2012
|
|
|
|
|
Nov.
6, 2012 President
| +Obama/Biden (D)
|
1,620,985
|
52.83%
|
Romney/Ryan
(R)
|
1,407,966
|
45.89%
|
Johnson/Gray
(I)
|
20,439
|
0.67%
|
Stein/Manski
(I)
|
7,665
|
0.25%
|
Goode/Clymer
(C)
|
4,930
|
0.16%
|
La
Riva/Ramirez (I)
|
533
|
0.02%
|
White/Scherrer
(I)
|
526
|
0.02%
|
write-ins
(2)
|
200
|
|
scattering
|
5,170
|
0.17%
|
|
3,068,434
|
|
|
|
Plurality: 213,019 votes
7.06
percentage points |
|
|
|
|
|
|
|
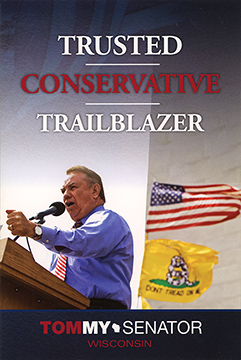
Nov.
6, 2012 U.S. Senate
| +Tammy Baldwin (D)
|
1,547,104
|
51.41%
|
Tommy
Thompson (R)
|
1,380,126
|
45.86%
|
Joseph
Kexel (I)
|
62,240
|
2.07%
|
Nimrod
Y.U.Allen III (I)
|
16,455
|
0.55%
|
write-ins
|
113
|
|
scattering
|
3,373
|
0.11%
|
|
3,009,411
|
|
Plurality: 166,978 votes
5.55
percentage points
|
|
 |
 |
|
|
|
|
|
|
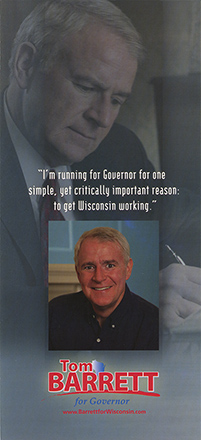
June
5, 2012 Governor Recall
| +Scott Walker (R) i
|
1,335,585
|
53.08%
|
Tom
Barrett (D)
|
1,164,480
|
46.28%
|
Hari
Trivedi (I)
|
14,463
|
0.57%
|
scattering
|
1,537
|
0.06%
|
|
2,516,065
|
|
Plurality: 171,105 votes
6.80 percentage points
|
|

|

|
|
| 2010
|
|
|
|
|
Nov.
2, 2010 Governor R+
+Scott Walker/
Rebecca Kleefisch (R)
|
1,128,941
|
52.25%
|
Tom
Barrett/
Tom Nelson (D)
|
1,004,303
|
46.48%
|
Jim
Langer (I)
|
10,608
|
0.49%
|
James James
(NA)
|
8,273
|
0.38%
|
nc/Terry
Virgil (L)
|
6,790
|
0.31%
|
write-in
and scattering
|
1,917
|
0.09%
|
|
2,160,832
|
|
Plurality: 124,638 votes
5.77 percentage
points
|
|
 |
 |
|
|
|
|
|
|
Nov. 2, 2010 U.S.
Senate R+
| +Ron Johnson (R)
|
1,125,999
|
51.86%
|
Russ
Feingold (D) i
|
1,020,958
|
47.02%
|
Rob
Taylor (C)
|
23,473
|
1.08%
|
write0in
and scattering
|
901
|
0.04%
|
|
2,171,331
|
|
Plurality: 105,041 votes
4.84 percentage
points
|
|
 |
 |
|
|
|
|
|
|
|