|
2022 |
|
Democrats |
Republicans |
Third
Party/Independent
|
Nov.
8, 2022 Governor
+Bill Lee (R)
|
1,128,097
|
64.93%
|
Jason
Martin (D)
|
572,153
|
32.93%
|
others
(8)
|
37,204
|
2.14%
|
|
1,737,454
|
|
Plurality: 555,944 votes
32.00 percentage
points
|
|
 |
 |
|
|
2020 |
|
|
|
|
Nov
3, 2020 President
+Trump/Pence
(R)
|
1,852,475
|
60.66%
|
Biden/Harris
(D)
|
1,143,711
|
37.45%
|
| Jorgensen/Cohen
(I) |
29,877
|
0.98%
|
others
(6)
|
26,926
|
0.88%
|
write-ins (5)
|
862
|
0.03%
|
|
3,053,851
|
|
|
|
|
Plurality: 708,764 votes
23.21 percentage points
|
|
|
|
|
|
|
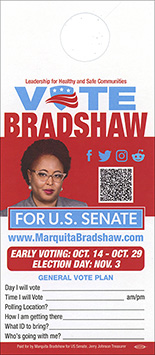
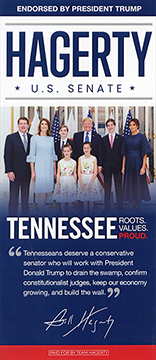
Nov. 3,
2020 U.S. Senate
+Bill Hagerty (R)
|
1,840,926
|
62.20%
|
Marquita Bradshaw (D)
|
1,040,691
|
35.16%
|
others
(9)
|
78,080
|
2.64%
|
write-ins (2)
|
64
|
|
|
2,959,761
|
|
Plurality: 800,235
votes
27.04 percentage points
|
|
 |
 |
|
| 2018
|
|
|
|
|
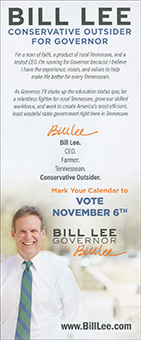
Nov.
6, 2018 Governor
+Bill Lee (R)
|
1,336,106
|
59.56%
|
Karl
Dean (D)
|
864,863
|
38.55%
|
others
(26)
|
42,314
|
1.89%
|
write-in
(1)
|
11
|
|
|
2,243,294
|
|
Plurality: 471,423 votes
21.01 percentage
points
|
|
 |
 |
|
|
|
|
|
|
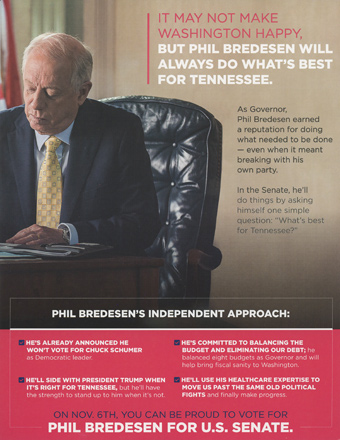
Nov.
6, 2018 U.S. Senate
+Marsha Blackburn (R)
|
1,227,483
|
54.71%
|
Phil Bredesen (D)
|
985,450
|
43.92%
|
others
(6)
|
30,807
|
1.37%
|
|
2,243,740
|
|
Plurality: 242,033 votes
10.79 percentage points
|
|
 |
 |
|
| 2016
|
|
|
|
|
Nov.
8, 2016 President
+Trump/Pence
(R)
|
1,522,925
|
60.72%
|
Clinton/Kaine
(D)
|
870,695
|
34.72%
|
Johnson/Weld
(I)
|
70,397
|
2.81%
|
Stein/Baraka
(I)
|
15,993
|
0.64%
|
McMullin
(w/in)
|
11,991
|
0.48%
|
others
(3)
|
14,228
|
0.57%
|
more
w/ins (7)
|
1,798
|
0.07%
|
|
2,508,027
|
|
|
|
|
Plurality: 652,230 votes
26.00 percentage points
|
|
| 2014
|
|
|
|
|
Nov.
4, 2014 Governor
+Bill Haslam (R) i
|
951,796
|
70.31%
|
Charles"Charlie" Brown(D)
|
309,237
|
22.84%
|
John Jay Hooker (I)
|
30,679
|
2.26%
|
Shaun Crowell (C)
|
26,580
|
1.96%
|
Isa Infante (G)
|
18,570
|
1.37%
|
Steven
Damon Coburn (I)
|
8,612
|
0.64%
|
Daniel T. Lewis (I)
|
8.321
|
0.62%
|
write-ins (3)
|
33
|
|
|
1,353,728
|
|
Plurality:
642,559 votes
47.47 percentage points
|
|
[Charlie Brown no
lit.] |
 |
 |
|
|
|
|
|
Nov.
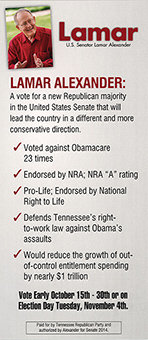
4, 2014 U.S. Senate
+Lamar Alexander (R) i
|
850,087
|
61.87%
|
Gordon Ball (D)
|
437,848
|
31.87%
|
Joe Wilmoth (C)
|
36,088
|
2.63%
|
Martin Pleasant (G)
|
12,570
|
0.91%
|
others (8)
|
37,467
|
2.73%
|
write-ins (2)
|
5
|
|
|
1,374,065
|
|
Plurality:
412,239 votes
30.00
percentage points |
|
 |
 |
|
| 2012
|
|
|
|
|
Nov.
6, 2012 President
+Romney/Ryan
(R)
|
1,462,330
|
59.48%
|
Obama/Biden (D)
|
960,709
|
39.08%
|
Johnson/Gray (I)
|
18,623
|
0.76%
|
Stein/Honkala (G)
|
6,515
|
0.26%
|
Goode/Clymer (C)
|
6,022
|
0.24%
|
Anderson/Rodriguez (I)
|
2,639
|
0.11%
|
Miller/Abernathy
(I)
|
1,739
|
0.07%
|
|
2,458,577
|
|
|
|
|
Plurality:
501,621 votes
20.40
percentage points |
|
|
|
|
|
|
Nov.
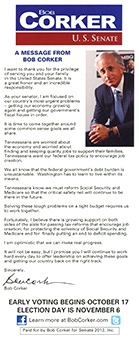
6, 2012 U.S. Senate
+Bob Corker (R) i
|
1,506,443
|
64.89%
|
Mark Clayton (D)
|
705,882
|
30.41%
|
| Martin
Pleasant (G) |
38,472
|
1.66%
|
Shaun E. Crowell I)
|
20,936
|
0.90%
|
Kermit
Steck (C)
|
18,620
|
0.80%
|
others (4)
|
29,836
|
1.19%
|
write-ins
|
1,288
|
|
|
2,321,447
|
|
Plurality:
800,561 votes
34.48
percentage points |
|
[no literature]
|
 |
|
| 2010
|
|
|
|
|
Nov.
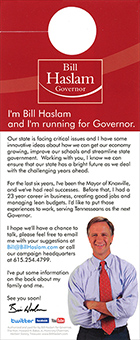
2, 2010 Governor
+Bill Haslam (R)
|
1,041,545
|
65.03%
|
Mike McWherter (D)
|
529,851
|
33.08%
|
| others (14)
|
30,112
|
1.88%
|
write-ins
|
61
|
|
|
1,601,569
|
|
Plurality:
511,694 votes
31.95
percentage points |
|
 |
 |
 |
|
|
|
|
|
|


