|
2022 |
|
Democrats |
Republicans |
Third
Party/Independent
|
Nov. 8,
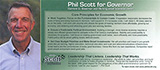
2022 Governor
+Phil Scott (R) i
|
202,147
|
70.98%
|
| Brenda
Siegel (P/D) |
68,248
|
23.96%
|
| Kevin Hoyt
(I) |
6,022
|
2.11%
|
| Peter Duval (I)
|
4,723
|
1.66%
|
Bernard
Peters (I)
|
2,315
|
0.81%
|
write-ins
|
1,346
|
0.47%
|
|
284,801
|
|
Plurality: 133,899 votes
47.02 percentage points
|
|
 |
 |
|
|
|
|
|
|
Nov. 8,
2022 U.S. Senate
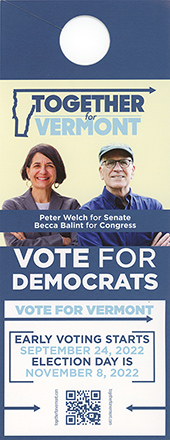
+Peter Welch (D)
|
196,575
|
68.47%
|
| Gerald
Malloy (R) |
80,468
|
28.03%
|
| Dawn Marie
Ellis (I) |
2,752
|
0.96%
|
| Natasha Diamondstone-Kohout
(GM) |
1,574
|
0.55%
|
Kerry
Raheb (I)
|
1,532
|
0.53%
|
Mark
Coester (I)
|
1,273
|
0.44%
|
Stephen
Duke (I)
|
1,209
|
0.42%
|
Cris
Ericson (I)
|
1,105
|
0.38%
|
write-ins
|
612
|
0.21%
|
|
287,100
|
|
Plurality: 116,107 votes
40.44 percentage
points
|
|
|
 |
|
|
2020 |
|
|
|
|
Nov
3, 2020 President
+Biden/Harris (D)
|
242,820
|
66.09%
|
Trump/Pence (R)
|
112,704
|
30.67%
|
Jorgensen/Cohen (L)
|
3,608
|
0.98%
|
| Hawkins/Walker |
1,310
|
0.36%
|
West/Tidball
|
1,269
|
0.35%
|
| Paige/Witman
|
1,175
|
0.32%
|
more candidates (15)
|
2,600
|
0.71%
|
| write-ins
|
1,942
|
0.53%
|
| Total........367,428
|
|
|
|
|
Plurality: 130,116 votes
35.08 percentage points
|
|
|
|
|
|
|
|
Nov. 3,
2020 Governor
+Phil Scott (R) i
|
248,412
|
68.48%
|
| David
Zuckerman (P/D) |
99,215
|
27.35%
|
| Kevin Hoyt
(I) |
4,576
|
1.26%
|
| Emily Peyton (TM)
|
3,505 |
0.97%
|
Erynn
Hazlett Whitney (I)
|
1,777
|
0.49%
|
Wayne
Billado III (I)
|
1,431
|
0.39%
|
Michael
A. Devost (I)
|
1,160
|
0.32%
|
Charley
Dickerson (unaff.)
|
1,037
|
0.29%
|
write-ins
|
1,598
|
0.44%
|
|
362,711
|
|
Plurality: 49,197 votes
41.13 percentage points
|
|
 |
 |
|
| 2018
|
|
|
|
|
Nov.
6, 2018 Governor
+Phil Scott (R) i
|
151,261
|
55.18%
|
Christine
Hallquist (D)
|
110,335
|
40.26%
|
Trevor
Barlow (I)
|
3,266
|
1.19%
|
Charles
Laramie (I)
|
2,287
|
0.83%
|
Cris
Ericson (I)
|
2,129
|
0.78%
|
Stephen
Marx (ER)
|
1,855
|
0.68%
|
Emily "Em"
Peyton (LU)
|
1,839
|
0.67%
|
write-ins
|
1,115
|
0.41%
|
|
274,087
|
|
Plurality: 40,926 votes
14.92 percentage
points
|
|
 |
 |
|
|
|
|
|
|
Nov.
6, 2018 U.S. Senate
+Bernie
Sanders (I) i
|
183,529
|
65.96%
|
Lawrence
Zupan (R)
|
74,663
|
26.83%
|
Brad
J. Peacock (I)
|
3,787
|
1.36%
|
Russell
Beste (I)
|
2,763
|
0.99%
|
Edward
Gilbert Jr. (I)
|
2,244
|
0.81%
|
Folasade
Adeluola (I)
|
1,979
|
0.71%
|
Jon
Svitavsky (I)
|
1,280
|
0.46%
|
Reid Kane
(LU)
|
1,171
|
0.42%
|
Bruce Busa
(I)
|
914
|
0.33%
|
w/ins
|
294
|
0.11%
|
|
272,
624
|
|
Plurality: 108,866
39.13 percentage
points
|
|
[Sanders (I) won then
declined
the Democratic nomination]
|
 |
 |
| 2016
|
|
|
|
|
Nov.
8, 2016 President
+Clinton/Kaine
(D)
|
178,573
|
56.68%
|
| Trump/Pence (R) |
95,369 |
30.27%
|
Johnson/Weld
(L)
|
10,078
|
3.20%
|
Stein/Baraka
(G)
|
6,758
|
2.14%
|
De La
Fuente/
Steinberg (I)
|
1,063
|
0.34%
|
LaRiva/Puryear
(LU)
|
327
|
0.10%
|
write-ins
|
22,899
|
7.27%
|
|
315,067 |
|
|
|
83,204 votes
26.41 percentage points
|
|
|
|
|
|
|
|
Nov.
8, 2016 Governor R+
+Phil Scott (R)
|
166,817
|
52.91%
|
Sue Minter (D)
|
139,253
|
44.17%
|
Bill "Spaceman" Lee (LU)
|
8,912
|
2.83%
|
write-ins
|
313
|
.10%
|
|
|
|
Plurality: 27,564
votes
8.74
percentage points
|
|
 |
 |
|
|
|
|
|
|
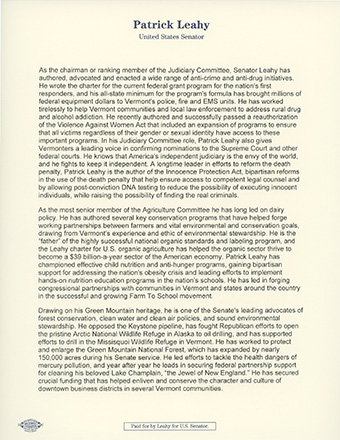
Nov.
8, 2016 U.S. Senate
+Patrick Leahy (D) i
|
|
61.26% |
Scott Milne (R)
|
|
33.03%
|
Cris
Ericson (USM)
|
9,156
|
2.92%
|
| Jerry
Trudell (I) |
5,223
|
1.66%
|
Pete
Diamondstone (LU)
|
3,241
|
1.03%
|
write-ins
|
309
|
0.10%
|
|
313,809
|
|
Plurality: 88,606 votes
28.23 percentage points
|
|
 |
 |
|
| 2014
|
|
|
|
|
Nov.
4, 2014 Governor
+Peter Shumlin (D) i
|
89,509
|
46.36%
|
| Scott Milne
(R) |
87,075
|
45.09%
|
| Dan
Feliciano (L) |
8,428
|
4.36%
|
| Emily Peyton (LU)
|
3,157 |
1.64%
|
Peter
Diamondstone (I)
|
1,673
|
0.87%
|
Bernard
Peters (I)
|
1,434
|
0.74%
|
Cris
Ericson (I)
|
1,089
|
0.56%
|
write-ins
|
722
|
0.37%
|
|
193,087
|
|
Plurality: 2,434 votes
1.26 percentage points |
|
 |
 |
|
| 2012
|
|
|
|
|
Nov.
6, 2012 President
+Obama/Biden (D)
|
199,239
|
66.57%
|
| Romney/Ryan
(R) |
92,698
|
30.97%
|
| Johnson/Gray
(L) |
3,487
|
1.17%
|
Anderson/Rodriguez (J)
|
1,128
|
0.37%
|
Lindsay/Osorio
(PS&L)
|
695
|
0.23%
|
write-ins
|
2,043
|
0.68%
|
|
299,290
|
|
|
|
Plurality: 106,541 votes
35.60 percentage points |
|
|
|
|
|
|
|
Nov.
6, 2012 Governor
+Peter Shumlin (D) i
|
170,749
|
57.80%
|
| Randy Brock
(R) |
110,940
|
37.55%
|
| Emilly
Peyton (I) |
5,868
|
1.99%
|
Cris Ericson (USM)
|
5,583 |
1.89%
|
David
Eagle (LU)
|
1,303
|
0.44%
|
write-ins
|
969
|
0.33%
|
|
295,412
|
|
Plurality: 59,809 votes
20.25 percentage points |
|
 |
 |
|
|
|
|
|
|
Nov.
6, 2012 U.S. Senate
+Bernie Sanders (I) i
|
207,848
|
70.86%
|
| John
MacGovern (R) |
72,898
|
24.85%
|
| Cris Ericson
(USM) |
5,924
|
2.02%
|
| Pete Diamondstone (LU)
|
2,511 |
0.86%
|
Peter
Moss (PP)
|
2,452
|
0.84%
|
Laurel
LaFramboise (VoteKISS)
|
1,431
|
0.54%
|
write-ins
|
252
|
0.09%
|
|
293,316
|
|
Plurality: 134,950 votes
46.01 percentage
points |
|
[Sanders (I) won then
declined
the Democratic nomination] |
 |
 |
| 2010
|
|
|
|
|
Nov.
2, 2010 Governor D+
+Peter Shumlin (D)
|
119,543
|
49.48%
|
| Brian Dubie
(R) |
115,212
|
47.69%
|
| Dennis
Steele (I) |
1,917
|
0.79%
|
Cris Ericson (USM)
|
1,819 |
0.75%
|
Dan
Feliciano (I)
|
1,341
|
0.56%
|
Em Peyton
(I)
|
684
|
0.28%
|
Ben
Mitchell (LU)
|
429
|
0.18%
|
write-ins
|
660
|
0.27%
|
|
241,605
|
|
Plurality: 4,331 votes
1.79 percentage points |
|
 |
 |
|
|
|
|
|
|
Nov.
2, 2010 U.S. Senate
+Patrick Leahy (D) i
|
151,281
|
64.33%
|
| Len Britton
(R) |
72,699
|
30.90%
|
Daniel
Freilich (I)
|
3,544
|
1.51%
|
| Cris Ericson
(USM) |
2,731
|
1.16%
|
| Stephen J. Cain (I) |
2,356 |
1.00%
|
Pete
Diamondstone (S)
|
1,433
|
0.61%
|
Johenry
Nunes (I)
|
1,209
|
0.51%
|
write-ins
|
113
|
|
|
235,178
|
|
Plurality: 78,582 votes
33.41 percentage
points |
|
 |
 |
|
|
|
|
|
|
|