|
2022 |
|
Democrats |
Republicans |
Third
Party/Independent
|
Nov. 8, 2022 U.S.
Senate
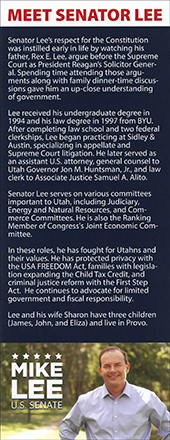
+Mike Lee
(R)
|
571,974
|
53.15%
|
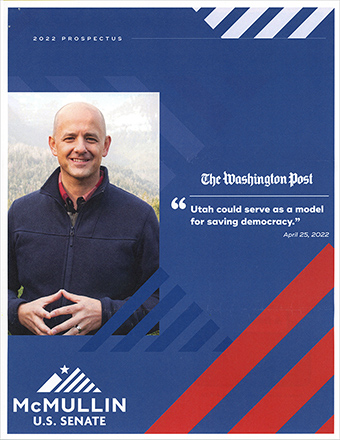
Evan
McMullin (unaff.)
|
459,958
|
42.74%
|
James
Hansen (L)
|
31,784
|
2.95%
|
Tommy
Williams (IA)
|
12,103
|
1.12%
|
write-ins
(3)
|
242
|
|
|
1,076,061
|
|
Plurality: 112,016 votes
10.41 percentage points |
|
[no candidate] |
 |
 |
|
2020 |
|
|
|
|
Nov
3, 2020 President
+Trump/Pence
(R)
|
865,140
|
58.13%
|
Biden/Harris
(D)
|
560,282
|
37.65%
|
| Jorgensen/Cohen
(L) |
38,447 |
2.58%
|
West/Tidball
(Unaff.)
|
7,213
|
0.48%
|
Blankenship/Mohr
(C)
|
5,551
|
0.37%
|
Hawkins/Walker (G)
|
5,053
|
0.34%
|
others
(3)
|
5,991
|
0.40%
|
write-ins (6)
|
1,961
|
0.55%
|
|
1,488,289
|
|
|
|
|
Plurality: 304,858 votes
20.48 percentage points
|
|
|
|
|
|
|
Nov. 3,
2020 Governor
+Spencer J. Cox/
Deidre M. Henderson (R)
|
918,754
|
62.98%
|
Chris
Peterson/
Karina Brown (D) |
442,754
|
30.35%
|
Daniel
Cottam/
Barry Short (L) |
51,393
|
3.52%
|
Greg Duerden/
Wayne Hill (IAP) |
25,810 |
1.77%
|
write-ins
(4)
|
20,167
|
1.38%
|
|
1,458,878
|
|
Plurality: 476,000 votes
32.63 percentage
points
|
|
 |
missing |
|
| 2018
|
|
|
|
|
Nov.
6, 2018 U.S. Senate
+Mitt
Romney (R)
|
665,215
|
62.59%
|
Jenny
Wilson (D)
|
328,541
|
30.91%
|
Tim
Aalders (C)
|
28,774
|
2.71%
|
Craig
Bowden (L)
|
27,607
|
2.60%
|
Reed
McCandless (IAP)
|
12,708
|
1.20%
|
write-ins
(7)
|
52
|
|
|
1,062,897
|
|
Plurality: 336,674 votes
31.68 percentage points |
|
 |
 |
|
| 2016
|
|
|
|
|
Nov.
8, 2016 President
+Trump/Pence (R)
|
515,231
|
45.54%
|
Clinton/Kaine
(D)
|
310,676
|
27.46%
|
McMullin/Johnson
(Unaff.)
|
243,690
|
21.54%
|
Johnson/Weld
(L)
|
39,608
|
3.50%
|
Stein/Baraka
(Unaff)
|
9,438
|
0.83%
|
| Castle/Bradley
(C) |
8,032
|
0.71%
|
others (4)
|
4,700 |
0.42% |
write-ins
(15)
|
46
|
|
|
1,131,430
|
|
|
|
|
Plurality: 204,555 votes
18.08 percentage points
|
|
|
|
|
|
|
Nov.
8, 2016 Governor
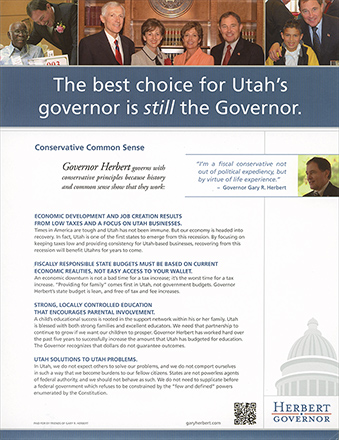
+Gary Herbert/
Spencer Cox (R) i
|
750,850
|
66.74%
|
Mike Weinholtz/
Kim Bowman (D)
|
323,349
|
28.74%
|
Brian Kamerath/
Barry Short (L)
|
34,827
|
3.10%
|
Superdell
Schanze/
Gregory Duerden (IAP)
|
15,912
|
1.41%
|
L.S. Brown (w/in)
|
97
|
|
|
|
|
Plurality: 427,501
votes
38.00
percentage points
|
|
 |
 |
|
|
|
|
|
|
Nov.
8, 2016 U.S. Senate
+Mike Lee (R) i
|
|
68.15% |
Misty Snow (D)
|
|
27.06%
|
Stoney
Fonua (IAP)
|
27,340
|
2.45%
|
Bill Barron
(I)
|
26,167
|
2.34%
|
|
1,115,608
|
|
Plurality: 458,381 votes
41.09 percentage points
|
|
 |
 |
|
| 2012
|
|
|
|
|
Nov.
6, 2012 President
+Romney/Ryan (R)
|
|
72.79% |
Obama/Biden (D)
|
|
24.75%
|
Johnson/Gray
(L)
|
12,572
|
1.24%
|
Anderson/Rodriguez
|
5,335
|
0.52%
|
Stein/Honkala
(G)
|
3,817
|
0.38%
|
Goode/Clymer
(C)
|
2,871
|
0.28%
|
La
Riva/Ramirez (U)
|
393
|
|
write-ins
|
39
|
|
|
1,017,440
|
|
|
|
|
Plurality: 488,787 votes
48.04 percentage points |
|
|
|
|
|
|
Nov.
6, 2012 Governor
+Gary Herbert/
Greg Bell (R)
i
|
|
68.41% |
Peter Cooke/
Vincent Rampton (D) |
|
27.58%
|
Ken Larsen/
J. Robert Latham (L) |
22,611
|
2.25%
|
Kirk
Pearson/
Tim Aalders (C) |
17,696
|
1.76%
|
write-ins
(2)
|
3
|
|
|
1,006,524
|
|
Plurality: 410,970 votes
40.83 percentage points
|
|
 |
|
|
|
|
|
|
|
Nov.
6, 2012 U.S. Senate
+Orrin Hatch (R) i
|
|
65.31% |
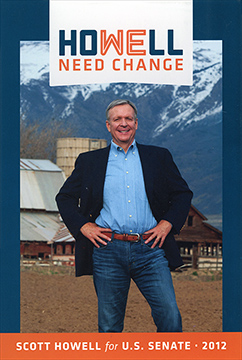
Scott Howell (D)
|
|
29.98%
|
ShaunMcCausland
(C)
|
31,905
|
3.17%
|
Daniel
Geery (J)
|
8,342
|
0.83%
|
Bill
Barron (U)
|
7,172
|
0.71%
|
write-ins
|
1
|
|
|
1,006,901
|
|
Plurality: 355,735 votes
35.33 percentage points
|
|
 |
 |
 |
| 2010
|
|
|
|
|
Nov.
6, 2012 Governor (special)
+Gary Herbert/
Greg Bell (R)
|
|
64.07% |
Peter
Corroon/
Sheryl Allen (D) |
|
31.90%
|
Farley Anderson/
Steve Maxfield (U) |
13,038
|
2.03%
|
W.
Andrew McCullough/
Eric Cramer Sr. (L) |
12,871
|
2.00%
|
write-in
|
1
|
|
|
643,306
|
|
Plurality: 206,905 votes
32.16 percentage points
|
|
 |
 |
|
|
|
|
|
|
Nov. 2, 2010 U.S.
Senate
+Mike Lee (R)
|
|
61.56% |
Sam Granato (D)
|
|
32.77%
|
Scott N.
Bradley
(C)
|
35,937
|
5.67%
|
write-ins
(3)
|
23
|
|
|
633,829
|
|
Plurality: 182,494 votes
28.79 percentage points
|
|
 |
 |
|
|
|
|
|
|
|