2022
|
|
Democrats |
Republicans |
Third
Party/Independent
|
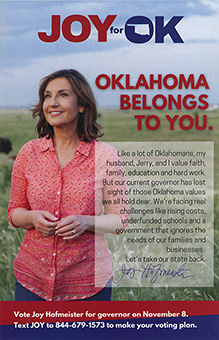
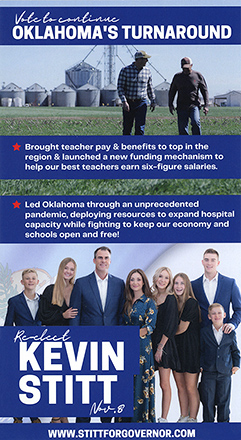
Nov. 8,
2022 Governor
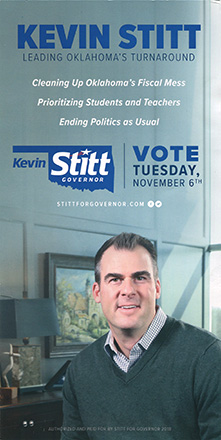
+Kevin Stitt (R) i
|
639,484
|
55.45%
|
Joy Hofmeister (D)
|
481,904
|
41.79%
|
| Natalie Bruno (L) |
16,243
|
1.41%
|
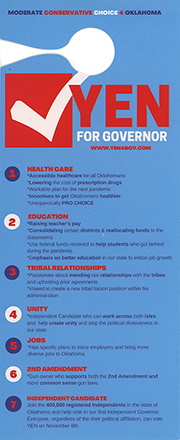
Ervin Yen (I)
|
15,653
|
1.36%
|
|
1,153,284
|
|
Plurality: 157,580 votes
13.66 percentage
points
|
|
 |
 |
 |
|
|
|
|
|
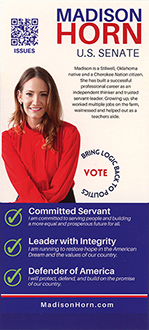
Nov. 8,
2022 U.S. Senate
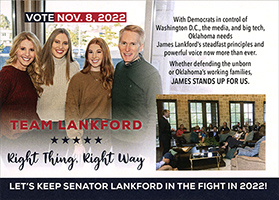
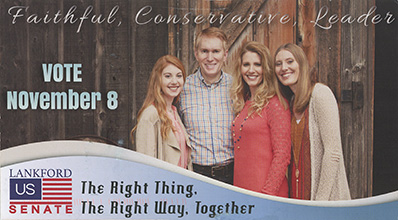
+James Lankford (R) i
|
739,960
|
64.30%
|
Madison Horn (D)
|
369,370
|
32.10%
|
| Michael L. Delaney (I) |
20,907
|
1.82%
|
Kenneth D. Blevins (L)
|
20,495
|
1.78%
|
|
1,150,732
|
|
Plurality: 370,590 votes
32.20 percentage
points
|
|
 |
 |
|
|
|
|
|
|
Nov. 8,
2022 U.S. Senate (special)
+Marwayne Mullins (R)
|
606,303
|
61.77%
|
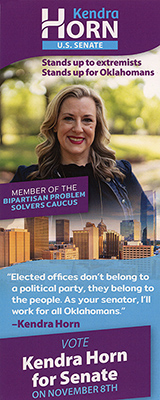
Kendra Horn (D)
|
311,112
|
35.24%
|
| Robert Murphy (L) |
15,403
|
1.51%
|
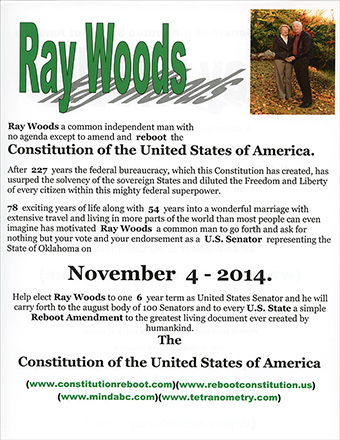
Ray Wood (I)
|
15,006
|
1.48%
|
|
1,150,481
|
|
Plurality: 295,191 votes
26.52 percentage
points
|
|
 |
 |
|
2020
|
|
|
|
|
Nov.
3, 2020 President
+Trump/Pence
(R)
|
1,020,280
|
65.37%
|
Biden/Harris (D)
|
503,890
|
32.29%
|
Jorgensen/Cohen (L)
|
24,731
|
1.58%
|
Simmons/Roze
(I)
|
3,654
|
0.23%
|
West/Tidball
(I)
|
5,597
|
0.36%
|
Pierce/Ballard
(I)
|
2,547
|
0.16%
|
|
1,560,699
|
|
|
|
|
Plurality:
516,390 votes
33.08 percentage points
|
|
|
|
|
|
|
Nov. 3,
2020
U.S. Senate
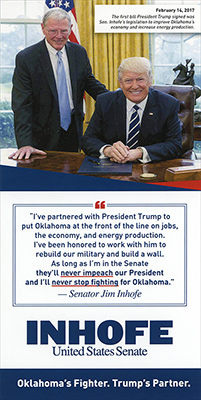
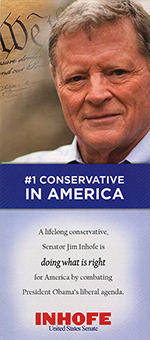
+Jim Inhofe (R) i
|
979,140
|
62.91%
|
Abby Broyles (D)
|
509,763
|
32.75%
|
| Robert Murphy (L) |
34,435
|
2.21%
|
Joan Farr (I)
|
21,652
|
1.39%
|
April Nesbit (I)
|
11,371
|
0.73%
|
|
1,556,361
|
|
Plurality: 469,377 votes
30.16 percentage
points
|
|
[did
not respond]
very unhelpful
|
 |
 |
| 2018
|
|
|
|
|
Nov.
6, 2018 Governor
+Kevin Stitt (R)
|
644,579
|
54.33%
|
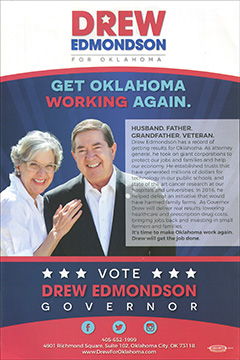
Drew Edmondson (D)
|
500,973
|
42.23%
|
Chris
Powell (L)
|
40,833
|
3.44%
|
|
1,186,385
|
|
Plurality:
143,606 votes
12.10 percentage
points
|
|
 |
 |
 |
| 2016
|
|
|
|
|
Nov.
8, 2016 President
+Trump/Pence (R)
|
949,136
|
65.32%
|
Clinton/Kaine (D)
|
420,375
|
28.93%
|
Johnson/Weld
(L)
|
83,481
|
5.75%
|
|
1,452,992
|
|
|
|
|
Plurality: 429,136 votes
36.39 percentage points
|
|
|
|
|
|
|
Nov.
8, 2016
U.S. Senate
+James Lankford (R) i
|
980,892
|
67.74% |
Mike Workman (D)
|
355,911
|
24.58%
|
Robert T. Murphy (L)
|
43,321
|
3.00%
|
Sean
Braddy (I)
|
40,405
|
2.79%
|
Mark
T. Beard (I)
|
27,418
|
1.89%
|
|
1,448,047
|
|
Plurality: 624,981 votes
43.16 percentage points |
|
[no literature
produced]
|
 |
|
| 2014
|
|
|
|
|
Nov.
4, 2014
U.S. Senate
+Jim Inhofe (R) i
|
558,166
|
68.01%
|
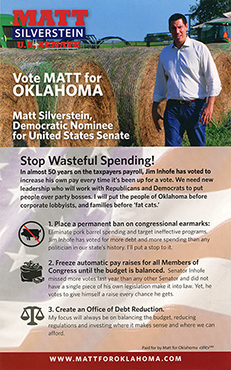
Matt Silverstein (D)
|
234,307
|
28.55%
|
| Joan Farr (I) |
10,554
|
1.29%
|
Ray Woods (I)
|
9,913
|
1.21%
|
Aaron DeLozier (I)
|
7,793
|
0.95%
|
|
820,733
|
|
Plurality: 323,859 votes
39.46 percentage
points
|
|
 |
 |
|
|
|
|
|
|
Nov.
4, 2014
U.S. Senate (special)
+James Lankford (R)
|
557,002
|
67.85%
|
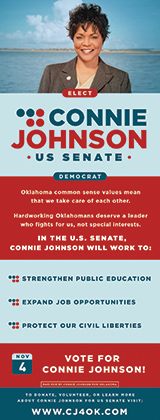
Connie Johnson (D)
|
237,923
|
28.98%
|
| Mark T. Beard (I) |
25,965
|
3.16%
|
|
820,890
|
|
Plurality: 319,079 votes
38.87 percentage
points
|
|
 |
 |
|
|
|
|
|
|
Nov.
4, 2014 Governor
+Mary Fallin (R) i
|
460,298
|
55.81%
|
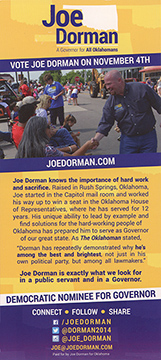
Joe Dorman (D)
|
338,239
|
41.01%
|
| Kimberly Willis (I) |
17,169
|
2.08%
|
Richard Prawdzienski (I)
|
9,125
|
1.11%
|
|
824,831
|
|
Plurality: 122,059 votes
14.80 percentage
points
|
|
 |
|
|
| 2012
|
|
|
|
|
Nov.
6, 2012 President
+Romney/Ryan (R)
|
891,325
|
66.77%
|
| Obama/Biden (D) |
443,547
|
33.23%
|
|
1,334,872
|
|
|
|
|
Plurality: 447,778 votes
33.54 percentage
points |
|
| 2010
|
|
|
|
|
Nov.
2, 2010 Governor
R+
+Mary Fallin (R)
|
625,506
|
60.45%
|
Jari Askins (D)
|
409,261
|
39.55%
|
|
1,034,767
|
|
Plurality: 216,245 votes
20.90 percentage
points
|
|
 |
 |
|
|
|
|
|
|
Nov.
2, 2010 U.S. Senate
+Tom Coburn (R) i
|
718,482
|
70.64%
|
Jim Rogers (D)
|
265,814
|
26.13%
|
| Stephen P. Wallace (I) |
25,048
|
2.46%
|
Ronald F.
Dwyer (I)
|
7,807
|
0.77%
|
|
1,017,151
|
|
Plurality: 452,668 votes
44.50 percentage
points
|
|
Jim
Rogers (D)
no response |
 |
|
|
|
|
|
|
|