|
2022 |
|
Democrats |
Republicans |
Third
Party/Independent
|
Nov. 8,
2022 Governor
+Mike
DeWine/
Jon Husted (R) i
|
2,580,424
|
62.41%
|
Nan
Whaley/
Cheryl Stephens (D)
|
1,545,489
|
37.38%
|
write-ins
(4)
|
8,964
|
0.22%
|
|
4,134,877
|
|
Plurality: 1,034,935 votes
25.03
percentage points
|
|
 |
 |
|
|
|
|
|
|
Nov. 8,
2022 U.S. Senate
+JD Vance
(R)
|
2,192,114
|
53.03%
|
Tim
Ryan (D)
|
1,939,489
|
46.92%
|
write-ins
(3)
|
1,739
|
0.04%
|
|
4,133,342
|
|
Plurality: 252,625 votes
6.11
percentage points
|
|
 |
 |
|
|
2020 |
|
|
|
|
Nov
3, 2020 President
+Trump/Pence
(R)
|
3,154,834 |
53.27% |
Biden/Harris (D)
|
2,679,165
|
45.24%
|
| Jorgensen/Cohen
(L) |
67,569 |
1.14% |
Hawkins/Walker
|
18,812
|
0.32%
|
| write-ins |
1,822
|
0.03%
|
|
5,922,202
|
|
|
|
|
Plurality:
475,669 votes
8.03 percentage points
|
|
| 2018
|
|
|
|
|
Nov. 6,
2018 Governor
+Mike
DeWine/
Jon Husted (R)
|
2,231,917
|
50.39%
|
Richard
Cordray/
Betty Sutton (D)
|
2,067,847
|
46.68%
|
Travis
Irvine/
J. Todd Grayson (L)
|
79,985
|
1.81%
|
C.
Gadell-Newton/
Brett Joseph (G)
|
49,475
|
1.12%
|
write-ins
(3)
|
358
|
|
|
4,429,582
|
|
Plurality: 160,070 votes
3.71
percentage points
|
|
 |
 |
|
|
|
|
|
|
Nov.
6, 2018 U.S. Senate
+Sherrod Brown (D) i
|
2,355,923
|
53.41%
|
Jim Renacci (R)
|
2,053,963
|
46.79%
|
Stephen Faris w/in
|
1,012
|
0.02%
|
|
4,410,898
|
|
Plurality: 301,960 votes
6.62 percentage
points
|
|
 |
 |
|
| 2016
|
|
|
|
|
Nov.
8, 2016 President
| +Trump/Pence
(R) |
2,841,005 |
51.69% |
Clinton/Kaine
(D)
|
2,394,164
|
43.56%
|
| Johnson/Weld |
174,498 |
3.17% |
Stein/Baraka
(G)
|
46,271
|
0.84%
|
| Duncan/Johnson
|
24,235 |
0.44% |
McMullin
(w/in)
|
12,574
|
0.23%
|
Castle
(w/in)
|
1,887
|
0.03%
|
more
w/ins (16)
|
1,853
|
|
|
5,496,487
|
|
|
|
|
Plurality: 446,841
votes
8.13 percentage points
|
|
|
|
|
|
|
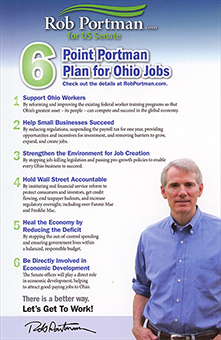
Nov.
8, 2016 U.S. Senate
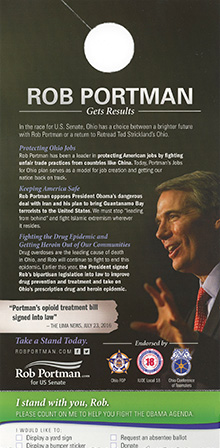
+Rob Portman (R) i
|
3,118,567 |
58.03%
|
Ted Strickland (D)
|
1,996,908 |
37.16%
|
Tom
Connors (I)
|
93,041 |
1.73%
|
Joe
DeMare (G)
|
88,246
|
1.64%
|
Scott Rupert (I)
|
77,291
|
1.44%
|
write-ins
|
111
|
|
|
5,374,164
|
|
Plurality: 1,121,659 votes
20.87 percentage points
|
|
 |
 |
|
| 2014
|
|
|
|
|
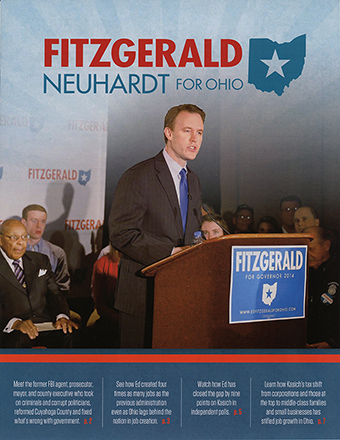
Nov.
4, 2014 Governor
+John
Kasich/
Mary Taylor (R) i
|
1,944,848
|
63.64%
|
Ed
FitzGerald/
Sharen Neuhardt (D)
|
1,009,359
|
33.03%
|
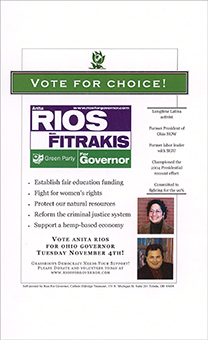
Anita Rios/
Bob Fitrakis (G)
|
101,706
|
3.3%
|
|
3,055,913
|
|
Plurality: 935,489 votes
30.61 percentage
points
|
|
 |
 |
 |
| 2012
|
|
|
|
|
Nov.
6, 2012 President
+Obama/Biden
(D)
|
2,827,621
|
50.67%
|
Romney/Ryan
(R)
|
2,661,407
|
47.69%
|
Johnson/Gray
(L)
|
49,493
|
0.89%
|
Stein/Honkala
(G)
|
18,574
|
0.33%
|
Duncan/Johnson
(I)
|
12,502
|
0.22%
|
Goode/Clymer
|
8,151
|
0.15%
|
Alexander/Mendoza
(S)
|
2,967
|
0.05%
|
write-ins
(6)
|
107
|
|
|
5,580,822
|
|
|
|
Plurality: 166,214 votes
2.98 percentage points |
|
|
|
|
|
|
|
Nov.
6, 2012 U.S. Senate
+Sherrod
Brown (D) i
|
2,762,766
|
50.70%
|
Josh
Mandel (R)
|
2,435,744
|
44.70%
|
Scott
Rupert (I)
|
250,618
|
4.60%
|
|
5,449,128
|
|
Plurality: 327,022 votes
6.00 percentage points
|
|
 |
 |
|
| 2010
|
|
|
|
|
Nov.
2, 2010 Governor R+
+John
Kasich/
Mary Taylor (R)
|
1,889,186
|
49.04%
|
Ted
Strickland/Yvette McGee Brown (D) i
|
1,812,059
|
47.04%
|
Ken
Matesz/Margaret Ann Leech (L)
|
92,116
|
2.39%
|
Dennis
Spisak/Anita
Rios (G)
|
58,475
|
1.52%
|
David
Sargent (w/in)
|
633
|
0.02%
|
|
3,852,469
|
|
Plurality: 77,127 votes
2.00 percentage points
|
|
 |
 |
 |
|
|
|
|
|
Nov.
2, 2010 U.S. Senate
+Rob
Portman (R) i
|
2,168,742
|
56.85%
|
Lee
Fisher (D)
|
1,503,297
|
39.40%
|
Eric Deaton
(C)
|
65,656
|
1.73%
|
Michael
Pryce (I)
|
50,101
|
1.31%
|
Daniel
LaBotz (S)
|
26,454
|
0.69%
|
Arthur
Sullivan (w/in)
|
648
|
0.02%
|
|
3,814,898
|
|
Plurality: 665,445 votes
17.44 percentage points
|
|
 |
 |
 |
|
|
|
|
|
|