|
2022 |
|
Democrats |
Republicans |
Third
Party/Independent
|
Nov. 8,
2022 Governor R+
+Joe
Lombardo (R)
|
497,377
|
48.81%
|
Steve Sisolak (D)
|
481,991
|
47.30%
|
Brandon Davis (L)
|
14,919
|
1.46%
|
NOTC
|
14,866
|
1.46%
|
Ed Bridges (IAP)
|
9,918
|
0.97%
|
|
1,019,071
|
|
Plurality: 15,386 votes
1.51 percentage points
|
|
 |
 |

|
|
|
|
|
|
Nov. 8,
2022 U.S. Senate
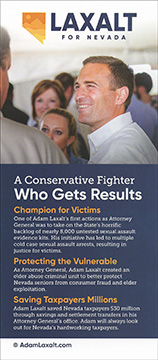
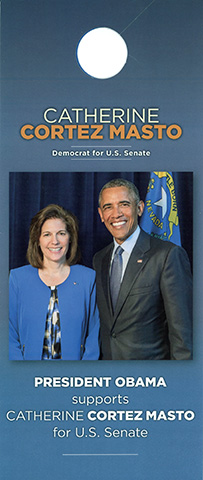
+Catherine
Cortez Masto (D) i
|
498,316
|
48.81%
|
Adam
Paul
Laxalt (R)
|
490,388
|
48.04%
|
NOTC
|
12,441
|
1.22%
|
Barry
Lindemann (I)
|
8,075
|
0.79%
|
Scott
Neil (L)
|
6,422
|
0.63%
|
Barry
Rubinson (IAP)
|
5,208
|
0.51%
|
|
1,020,850
|
|
Plurality: 7,928 votes
0.78 percentage points
|
|
 |
 |
|
|
2020 |
|
|
|
|
Nov
3, 2020 President
| +Biden/Harris (D) |
703,486 |
50.06% |
Trump/Pence (R)
|
669,890
|
47.67%
|
Jorgensen/Cohen
(L)
|
14,783
|
1.05%
|
NOTC
|
14,079
|
1.00%
|
| Blankenship/Mohr
(IAP) |
3,138 |
0.22% |
|
1,405,376
|
|
|
|
Plurality:
33,596 votes
2.39 percentage points
|
|
|
| 2018
|
|
|
|
|
Nov. 6,
2018 Governor D+
+Steve
Sisolak (D)
|
480,007
|
49.39%
|
Adam
Paul Laxalt (R)
|
440,320
|
45.31%
|
NOTC
|
18,865
|
1.94%
|
Ryan Bundy
(NPP)
|
13,891
|
1.43%
|
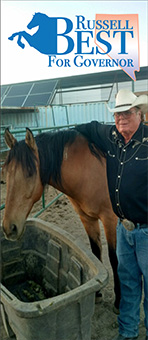
Russell
Best (IAP)
|
10,076
|
1.04%
|
Jared Lord
(L)
|
8,640
|
0.89%
|
|
971,799
|
|
Plurality: 39,687 votes
4.08 percentage points
|
|
 |
 |
  |
|
|
|
|
|
Nov.
6, 2018 U.S. Senate
D+
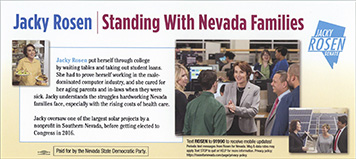
+Jacky
Rosen (D)
|
490,071
|
50.41%
|
Dean
Heller (R) i
|
441,202
|
45.38%
|
NOTC
|
15,303
|
1.57%
|
Barry
Michaels (NPP)
|
9,269
|
0.95%
|
Tim Hagan
(L)
|
9,196
|
0.95%
|
Kamau
Bakari (IAP)
|
7,091
|
0.73%
|
|
972,132
|
|
Plurality: 48,869 votes
5.03 percentage points
|
|
 |
 |
|
| 2016
|
|
|
|
|
Nov.
8, 2016 President
+Clinton/Kaine (D)
|
539,260
|
47.92%
|
Trump/Pence
(R)
|
512,058
|
45.50%
|
Johnson/Weld
(L)
|
37,384
|
3.32%
|
NOTC
|
28,863
|
2.56%
|
Castle/Bradley(IAP)
|
5,268
|
0.47%
|
De la Fuente
|
2,552
|
0.23%
|
|
1,125,385 |
|
|
|
Plurality:
27,202 votes
2.42 percentage points
|
|
|
|
|
|
|
|
Nov.
8, 2016 U.S. Senate
+Catherine Cortez Masto (D)
|
521,994 |
47.10% |
Joe Heck (R)
|
495,079 |
44.67%
|
NOTC
|
42,257
|
3.81%
|
| Tom Jones
(IAP) |
17,128
|
1.55%
|
Tom Sawyer
(NPP)
|
14,208
|
1.28%
|
Tony Gumina
(NPP)
|
10,740
|
0.97%
|
Jarrod
Williams (NPP)
|
6,888
|
0.62%
|
|
1,108,294
|
|
Plurality: 26,715
votes
2.43
percentage points
|
|
 |
 |
|
| 2014
|
|
|
|
|
Nov.
4, 2014 Governor
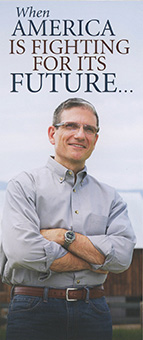
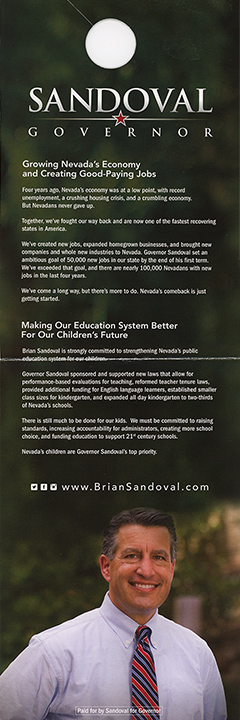
| +Brian
Sandoval (R) i
|
386,340
|
70.58%
|
Robert
"Bob" Goodman (D)
|
130,722
|
23.88%
|
NOTC
|
15,751
|
2.88%
|
David
Vanderbeek (IAP)
|
14,536
|
2.66%
|
|
547,349
|
|
Plurality: 255,618 votes
46.70 percentage points |
|
[Robert "Bob"
Goodman] |
 |
|
| 2012
|
|
|
|
|
Nov.
6, 2012 President
| +Obama/Biden
(D)
|
531,373
|
52.36%
|
Romney/Ryan
(R)
|
463,567
|
45.68%
|
Johnson/Gray
(L)
|
10,968
|
1.08%
|
NOTC
|
5,770
|
0.57%
|
Goode/Clymer
(IAP)
|
3,240
|
0.32%
|
|
1,014,918
|
|
|
|
Plurality: 67,806 votes
6.68 percentage
points |
|
|
|
|
|
|
|
Nov.
6, 2012 Senate
| +Dean
Heller (R) i
|
457,656
|
45.87%
|
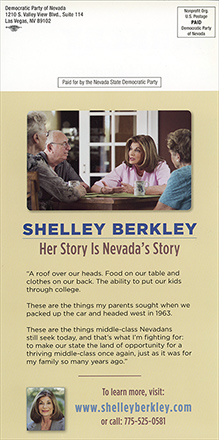
Shelley
Berkley (D)
|
446,080
|
44.71%
|
David Vanderbeek (IAP)
|
48,792
|
4.89%
|
| NOTC
|
45,277
|
4.54%
|
|
997,805
|
|
Plurality: 11,576 votes
1.16 percentage points |
|
 |
 |
|
| 2010
|
|
|
|
|
Nov. 2, 2010 Governor
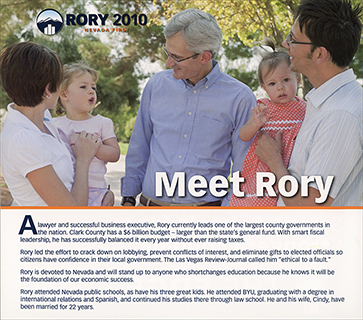
| +Brian
Sandoval (R)
|
382,350
|
53.36%
|
Rory
Reid (D)
|
298,171
|
41.61%
|
NOTC
|
12,231
|
1.71%
|
others (5)
|
23,777
|
3.32%
|
|
716,529
|
|
Plurality:
84,179 votes
11.75 percentage points
|
|
|
 |
|
|
|
|
|
|
Nov. 2, 2010 Senate
| +Harry Reid
(D) i
|
362,785
|
50.29%
|
Sharron
Angle (R)
|
321,361
|
44.55%
|
NOTC
|
16,197
|
2.25%
|
| others
(6) |
21,061
|
2.92%
|
|
721,404
|
|
Plurality: 41,424 votes
5.74 percentage
points |
|
 |
 |
|
|
|
|
|
|
|