|
2022 |
|
Democrats |
Republicans |
Third
Party/Independent
|
Nov. 8,
2022 U.S. Senate
+Eric Schmitt (R)
|
1,146,966
|
55.43%
|
Trudy Busch Valentine (D)
|
872,694
|
42.18%
|
Jonathan Dine (L)
|
34,821
|
1.68%
|
Paul Venable (C)
|
14,608
|
0.71%
|
write-ins
|
41
|
|
|
2,069,130
|
|
Plurality: 274,272 votes
13.26 percentage
points
|
|
 |
 |
|
|
2020 |
|
|
|
|
Nov
3, 2020 President
+Trump/Pence
(R)
|
1,718,736
|
56.80%
|
Biden/Harris
(D)
|
1,253,014
|
41.41%
|
Jorgensen/Cohen
(L)
|
41,205
|
1.36%
|
Hawkins/Walker
(G)
|
8,283
|
0.27%
|
Blankenship/Mohr
(C)
|
3,919
|
0.13%
|
| write-ins
(4) |
805
|
0.03%
|
|
3,025,962
|
|
|
|
|
Plurality: 465,722 votes
15.39 percentage
points
|
|
|
|
|
|
|
Nov. 3,
2020 Governor
+Mike Parson (R) i
|
1,720,202
|
57.11%
|
Nicole Galloway (D)
|
1,225,771
|
41.41%
|
Rik Combs (L)
|
49,067
|
1.63%
|
Jerome Bauer (G)
|
17,234
|
0.57%
|
write-ins
|
13
|
|
|
3,012,287
|
|
Plurality: 494,431 votes
15.70 percentage
points
|
|
 |
 |
|
| 2018
|
|
|
|
|
Nov.
6, 2018 U.S. Senate
R+
+Josh Hawley (R)
|
1,254,927
|
51.38%
|
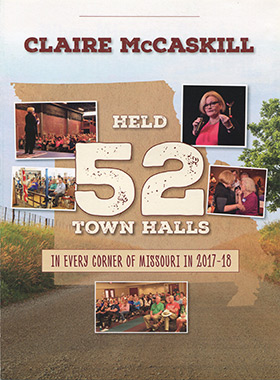
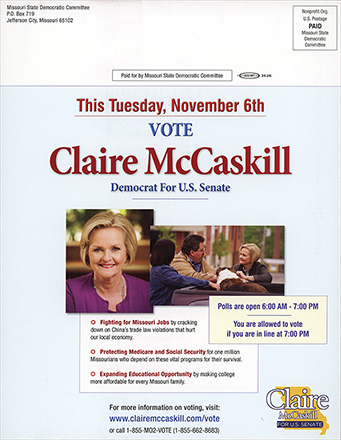
Claire McCaskill (D) i
|
1,112,935
|
45.57%
|
Craig O'Dear (I)
|
34,398
|
1.41%
|
Japheth
Campbell (L)
|
27,316
|
1.12%
|
Jo Crain
(G)
|
12,706
|
0.52%
|
write-ins
|
7
|
|
|
2,442,289
|
|
Plurality:
141,992 votes
5.81 percentage points |
|
 |
 |
 |
| 2016
|
|
|
|
|
Nov.
8, 2016 President
+Trump/Pence
(R)
|
1,594,511
|
56.77%
|
Clinton/Kaine
(D)
|
1,071,068
|
38.14%
|
Johnson/Weld
(L)
|
97,359
|
3.47%
|
Stein/Baraka
(G)
|
25,419
|
0.91%
|
Castle/Bradley
(C)
|
13,092
|
0.47%
|
McMullin/Johnson
(w/in)
|
7,071
|
0.25%
|
more w/ins
(4)
|
85
|
-
|
|
2,808,605 |
|
|
|
|
Plurality: 523,443 votes
18.63 percentage points
|
|
|
|
|
|
|
Nov.
8, 2016 Governor R+
+Eric
Greitens (R)
|
1,433,397
|
51.14%
|
Chris
Koster (D)
|
1,277,360
|
45.57%
|
Cisse
W Spragins (L)
|
41,154
|
1.47%
|
| Lester
Turilli Jr. (I) |
30,019
|
1.07%
|
Don
Fitz (G)
|
21,088
|
0.75%
|
write-ins
|
28
|
|
|
2,803,046
|
|
Plurality: 156,037 votes
5.57 percentage
points
|
|
 |
 |
|
|
|
|
|
|
Nov.
8, 2016 U.S. Senate
+Roy Blunt (R) i
|
|
49.19% |
Jason Kander (D)
|
|
46.39%
|
Jonathan
Dine (L)
|
67,738
|
2.42%
|
Jonathan
McFarland (G)
|
30,743
|
1.10%
|
Fred Ryman
(C)
|
25,407
|
0.91%
|
write-ins
|
95
|
|
|
2,802,641
|
|
Plurality: 78,258 votes
2.79 percentage
points |
|
 |
 |
|
| 2012
|
|
|
|
|
Nov.
6, 2012 President
+Romney/Ryan (R)
|
|
53.76% |
| Obama/Biden (D)
|
|
44.38%
|
Johnson/Gray
(L)
|
43,151
|
1.56%
|
Goode/Clymer
(C)
|
7,936
|
0.29%
|
|
2,757,323
|
|
|
|
|
Plurality: 258,644 votes
9.38 percentage
points |
|
|
|
|
|
|
Nov.
6, 2012 Governor
+Jay Nixon (D) i
|
|
49.19% |
Dave Spence (R)
|
|
46.39%
|
Jim
Higgins (L)
|
67,738
|
2.42%
|
write-ins
|
53
|
|
|
2,727,883
|
|
Plurality: 333,791 votes
12.24 percentage
points |
|
 |
 |
 |
|
|
|
|
|
Nov.
6, 2012 U.S. Senate
+Claire McCaskill (D) i
|
|
54.81% |
Todd Akin (D)
|
|
39.11%
|
Jonathan
Dine (L)
|
165,468
|
6.07%
|
write-ins
|
41
|
|
|
2,725,793
|
|
Plurality: 427,966 votes
15.70 percentage
points |
|
 |
 |
|
| 2010
|
|
|
|
|
Nov.
2, 2010 U.S. Senate
+Roy Blunt (R)
|
|
54.23% |
Robin Carnahan (D)
|
|
40.63%
|
Jonathan
Dine (L)
|
58,663
|
3.02%
|
Jerry
Beck (C)
|
41,309
|
2.13%
|
write-ins
|
31
|
|
|
1,943,899
|
|
Plurality: 264,424 votes
13.60 percentage
points |
|
 |
 |
|
|