|
2022 |
|
Democrats |
Republicans |
Third
Party/Independent
|
Nov. 8, 2022
Governor
+Janet Mills (D) i
|
376,934
|
55.69%
|
Paul LePage (R)
|
287,304
|
42.45%
|
| Sam
Hunkler (I) |
12,581
|
1.86%
|
|
676,819
|
|
Plurality: 89,630 votes
13.24 percentage points
|
|
 |
 |
|
|
2020 |
|
|
|
|
Nov.
3, 2020 President
+Biden/Harris (D)
|
435,072
|
53.09%
|
| Trump/Pence
(R) |
360,737 |
44.02% |
| Jorgensen/Cohen
(L) |
14,152 |
1.73% |
| Hawkins/Walker
(Grn.Ind.) |
8,230 |
1.00% |
DeLaFuente/Richardson (A)
|
1,183
|
0.14%
|
others
|
87
|
|
|
819,461
|
|
|
|
CD1
Total: 443,112
Plurality: 102,331 votes
23.09 percentage
points
Statewide
Plurality: 74,335 votes
9.07
percentage points
|
CD2
Total: 376,349
Plurality: 27,966 votes
7.44
percentage points
|
|
|
|
|
|
|
Nov.
3, 2020 U.S. Senate
+Susan Collins (R)
i
|
417,645
|
50.98%
|
Sara Gideon (D)
|
347,223
|
42.39%
|
| Lisa
Savage (I) |
40,579
|
4.95%
|
Max
Linn (I)
|
13,508
|
1.65%
|
others
|
228
|
|
|
819,183
|
|
Plurality:
70,422 votes
8.59 percentage points
|
|
 |
 |

|
| 2018
|
|
|
|
|
Nov.
6, 2018 Governor D+
+Janet Mills (D)
|
320,962
|
50.89%
|
Shawn Moody (R)
|
272,311
|
43.18%
|
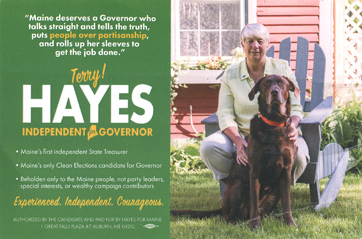
Terry Hayes (I)
|
37,268
|
5.91%
|
others
|
126
|
|
|
630,667
|
|
Plurality:
45,651 votes
7.71 percentage points
|
|
 |
 |

 |
|
|
|
|
|
Nov.
6, 2018 Senate
+Angus King (I) i
|
344,575
|
54.31%
|
Eric Brakey (R)
|
223,502
|
35.22%
|
Zak
Ringelstein (D)
|
66,268
|
10.45%
|
others
|
64
|
|
|
634,409
|
|
Plurality: 121,073 votes
19.09 percentage
points
|
|
 |
 |
 |
| 2016
|
|
|
|
|
Nov.
8, 2016
President
+Clinton/Kaine (D)
|
357,735
|
47.83%
|
| Trump/Pence
(R) |
335,593 |
44.86% |
Johnson/Weld
(L)
|
38,105
|
5.09%
|
Stein/Baraka (Grn.Ind.)
|
14,251
|
1.91%
|
write-ins
(4)
|
2,243
|
|
|
747,927 |
|
|
|
CD1
Total: 394,329 votes
Plurality:
58,390 votes
14.81 percentage
points
Statewide
Plurality: 22,142 votes*
2.97 percentage points
*includes
Uniformed Service and Overseas votes
|
CD2
Total: 353,416 votes
Plurality: 36,360 votes
10.29 percentage points
|
|
| 2014
|
|
|
|
|
Nov.
4, 2014 Governor
+Paul LePage (R) i
|
294,519
|
48.18%
|
Mike Michaud (D)
|
265,114
|
43.37%
|
Eliot
Cutler (I)
|
51,515
|
8.43%
|
others
|
79
|
|
|
611,227
|
|
Plurality:
29,405 votes
4.81 percentage
points
|
|
 |
 |
 |
|
|
|
|
|
Nov.
4, 2014 Senate
+Susan Collins (R)
i
|
413,495
|
68.46%
|
Shenna Bellows (D)
|
190,244
|
31.50%
|
others
|
269
|
|
|
604,008
|
|
Plurality:
223,251 votes
36.96 percentage
points |
|
 |
[seeking
Collins lit.]
|
|
| 2012
|
|
|
|
|
Nov.
6, 2012 President
+Obama/Biden (D) i
|
401,306
|
56.27%
|
Romney/Ryan (R)
|
292,276
|
40.92%
|
Johnson/Gray
(L)
|
9,352
|
1.31%
|
Stein/Honkala
(Grn.Ind.)
|
8,119
|
1.14%
|
write-ins
(3)
|
2,127
|
0.30%
|
|
713,180
|
|
|
|
CD1 21.39 percentage points
CD2
8.56 percentage points
Statewide
Plurality: 109,030 votes
15.35
percentage points |
|
|
|
|
|
|
|
Nov.
6, 2012 Senate I+
+Angus King (I)
|
370,580
|
52.89%
|
Charlie Summers (R)
|
215,399
|
30.74%
|
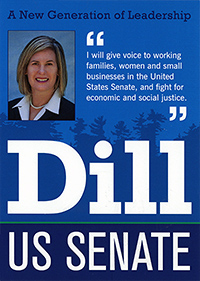
Cynthia
Dill (D)
|
92,900
|
13.26%
|
Stephen
Woods (I)
|
10,289
|
1.47%
|
Danny
Dalton (NP)
|
5,807
|
0.83%
|
Andrew
Ian Dodge (NP)
|
5,624
|
0.80%
|
|
700,599
|
|
Plurality:
155,181 votes
22.15 percentage
points |
|
 |
 |
  |
| 2010
|
|
|
|
|
Nov. 2, 2010
Governor R+
+Paul LePage (R)
|
218,065
|
38.07%
|
Eliot Cutler (I)
|
208,270
|
36.36%
|
Libby
Mitchell (D)
|
109,387
|
19.10%
|
Shawn
Moody (I)
|
28,756
|
5.02%
|
Kevin L.
Scott (I)
|
5,664
|
0.99%
|
Others
|
2,624
|
0.46%
|
|
572,766
|
|
Plurality:
9,795 votes
1.71 percentage
points |
|
 |
 |

 |
|

