2022
|
|
Democrats |
Republicans |
Third
Party/
Independent
|
Nov. 8,
2022 Governor D+
+Maura Healey/
Kim Driscoll (D)
|
1,581,214
|
63.69%
|
Geoff Diehl/
Leah Allen (R)
|
859,433
|
34.62%
|
Kevin
Reed/
Peter Everett (L)
|
39,205
|
1.58%
|
all
others
|
2,794
|
0.21%
|
|
3,564,136
|
|
Plurality: 721,781 votes
29.07 percentage
points
|
|
 |
 |
|
2020
|
|
|
|
|
Nov
3, 2020 President
+Biden/Harris
(D)
|
2,382,202
|
65.60%
|
Trump/Pence (R)
|
1,167,202
|
32.14%
|
| Jorgensen/Cohen
(L) |
47,013
|
1.29%
|
| Hawkins/Walker (GR) |
18,658
|
0.51%
|
all others
|
16,327
|
0.44%
|
|
3,631,402
|
|
|
|
Plurality:
1,215,000 votes
33.46 percentage points
|
|
|
|
|
|
|
|
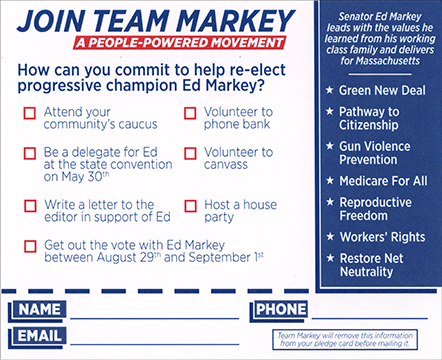
Nov. 3,
2020 U.S. Senate
+Ed Markey (D) i
|
2,357,809
|
66.15%
|
Kevin O'Connor (R)
|
1,177,765
|
33.04%
|
| Shiva Ayyadurai (w/in) |
21,134
|
0.59%
|
all
others
|
7,428
|
0.21%
|
|
3,564,136
|
|
Plurality: 1,180,044 votes
33.11 percentage
points
|
|
 |
 |
|
| 2018
|
|
|
|
|
Nov.
6, 2018 Governor
+Charlie
Baker/
Karyn Polito (R) i
|
1,781,341
|
66.60%
|
Jay
Gonzalez/
Quentin Palfrey (D)
|
885,770
|
33.12%
|
all
others
|
7,504
|
0.28%
|
|
2,674,615
|
|
Plurality: 895,571 votes
33.48 percentage
points
|
|
 |
 |
|
|
|
|
|
|
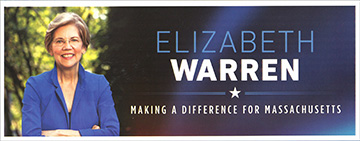
Nov.
6, 2018 U.S. Senate
+Elizabeth Warren(D)
i
|
1,633,371
|
60.34%
|
Geoff Diehl (R)
|
979,210
|
36.17%
|
Shiva Ayyadurai (I)
|
91,710
|
3.39%
|
all others
|
2,799
|
0.10%
|
|
2,707,090
|
|
Plurality: 654,161 votes
24.17 percentage points
|
|
 |
 |
|
| 2016
|
|
|
|
|
Nov.
8, 2016 President
+Clinton/Kaine
(D)
|
1,995,196
|
61.87%
|
Trump/Pence
(R)
|
1,090,893
|
33.83%
|
Johnson/Weld (L)
|
138,018
|
4.28%
|
Stein/Baraka
(GR)
|
47,661
|
1.48%
|
write-ins
(5)
|
2,790
|
0.09%
|
all
others
|
50,488
|
1.57%
|
|
3,225,046
|
|
|
|
Plurality: 904,303 votes
28.04
percentage points
|
|
|
| 2014
|
|
|
|
|
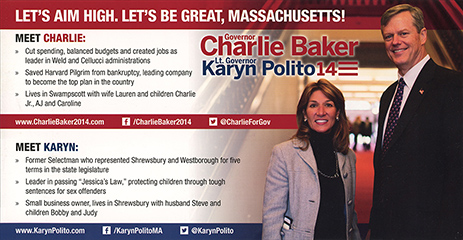
Nov.
4, 2014 Governor R+
+Charlie
Baker/
Karyn Polito (R)
|
1,044,573
|
48.40%
|
Martha
Coakley/
Steve Kerrigan (D)
|
1,004,408
|
46.54%
|
Evan
Falchuk/
Angus Jennings (UIP)
|
71,814
|
3.33%
|
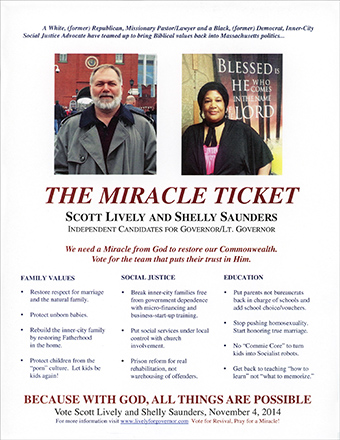
Scott
Lively/
Shelly Saunders
(Un.)
|
19,378
|
0.90%
|
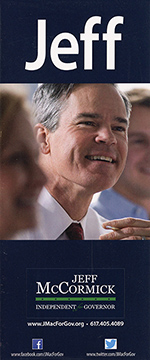
Jeff
McCormick/
Tracy Post (Un.)
|
16,295
|
0.75%
|
all
others
|
1,858
|
0.09%
|
|
2,158,326
|
|
Plurality: 40,165 votes
1.86 percentage
points
|
|
 |
 |
   |
|
|
|
|
|
Nov.
4, 2014 U.S. Senate
+Ed Markey (D) i
|
1,289,944
|
61.87%
|
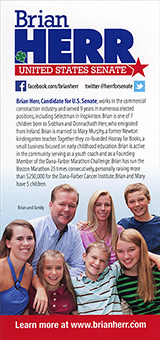
Brian J. Herr (R)
|
791,950
|
37.98%
|
| Brian
R. Muello (w/in) |
6
|
|
all
others
|
3,072
|
0.15%
|
|
2,084,972
|
|
Plurality: 497,994 votes
23.88 percentage
points |
|
 |
 |
|
| 2013
|
|
|
|
|
June
25, 2013 U.S. Senate (special)
+Ed Markey (D)
|
645,429
|
54.80%
|
Gabriel Gomez (R)
|
525,307
|
44.60%
|
| Richard
A. Heos (TV) |
4,550
|
0.39%
|
all
others
|
2,504
|
0.21%
|
|
1,177,790
|
|
Plurality: 120,122 votes
10.20 percentage points
|
|
 |
 |
|
| 2012
|
|
|
|
|
Nov.
6, 2012 President
+Obama/Biden
(D)
|
1,921,290
|
60.65%
|
Romney/Ryan (R)
|
1,188,314
|
37.51%
|
| Johnson/Gray
(L) |
30.920
|
0.98%
|
Stein/Honkala
(GRB)
|
20,691
|
0.65%
|
all
others
|
6,552
|
0.21%
|
|
3,167,767
|
|
|
|
Plurality: 732,976 votes
23.14 percentage points |
|
|
|
|
|
|
|
Nov.
6, 2012 U.S. Senate D+
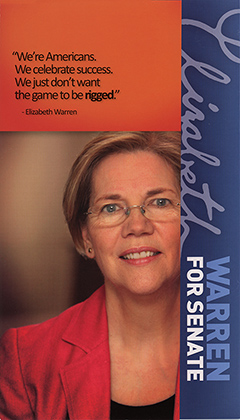
+Elizabeth Warren
(D)
|
1,696,346
|
53.74%
|
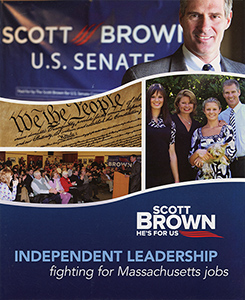
Scott Brown (R) i
|
1,458,048
|
46.19%
|
all
others
|
2,159
|
0.21%
|
|
3,156,553
|
|
Plurality: 238,298 votes
7.55 percentage points
|
|
 |
 |
|
| 2010
|
|
|
|
|
Nov.
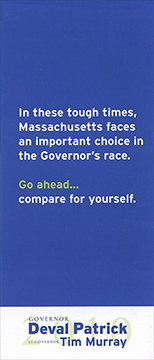
2, 2010 Governor
+Deval Patrick/
Tim Murray (D) i
|
1,112,283
|
48.42%
|
Charles Baker/
Richard Tisei (R)
|
964,866
|
42.00%
|
Tim
Cahill/
Paul Loscocco (I) |
184,395
|
8.03%
|
Jill
Stein/
Richard Purcell(GRB)
|
32,895
|
1.43%
|
all
others
|
2,600
|
0.11%
|
|
2,297,039
|
|
Plurality: 147,417 votes
6.42 percentage points |
|
 |
 |
  |
|
|
|
|
|
Jan.
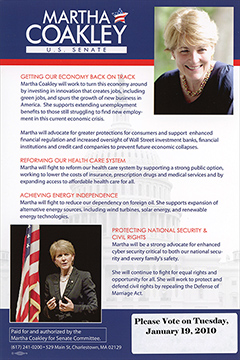
19, 2010 U.S. Senate R+
(special)
+Scott Brown (R)
|
1,168,178
|
51.86%
|
Martha Coakley D)
|
1,060,861
|
47.10%
|
Joseph L.
Kennedy (Un.)
|
22,388
|
0.99%
|
all
others
|
1,155
|
|
|
2,252,582
|
|
Plurality: 107,317 votes
4.76 percentage points
|
|
 |
 |
|
|

