|
2023 |
|
Democrats |
Republicans |
Third
Party/Independent
|
Oct. 14, 2023
Governor
(Blanket Primary)
+Jeff Landry (R)
|
547,827
|
51.56%
|
Shawn Kennedy (D)
|
275,525
|
25.93%
|
Stephen Waguespack (R)
|
62,287
|
5.86%
|
John Schroder (R)
|
56,654
|
5.33%
|
Hunter
Lundy (I)
|
52,165
|
4.91%
|
Danny
Cole (D)
|
27,662
|
2.60
|
Sharon
Hewitt (R)
|
18,468
|
1.74%
|
others
(8)
|
21,910
|
<
1%
each
|
|
1,062,498
|
|
Plurality: 272,302 votes
25.63 percentage points
|
|
 |
 |
|
|
2022 |
|
|
|
|
Nov. 8,
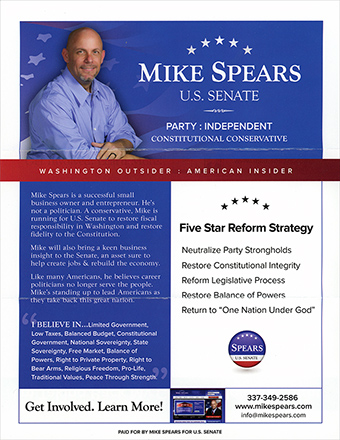
2022 U.S. Senate
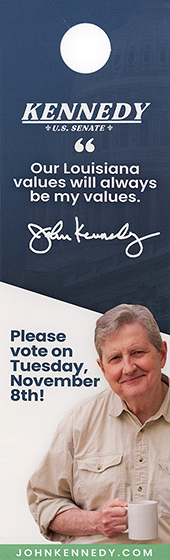
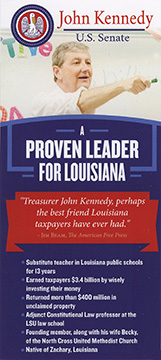
+John Kennedy (R) i
|
851,568
|
61.56%
|
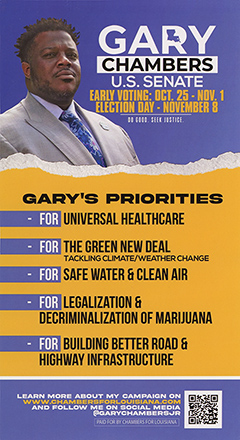
Gary Chambers (D)
|
246,933
|
17.85%
|
Luke Mixon (D)
|
182,887
|
13.22%
|
Syrita Steib (D)
|
31,568
|
2.28%
|
Devin
Lance
Graham (R)
|
25,275
|
1.83%
|
Others
(8)
|
45,059
|
<
1%
each
|
|
1,383,290
|
|
Plurality: 604,635 votes
43.71 percentage points
|
|
 |
 |
|
|
2020 |
|
|
|
|
Nov
3, 2020 President
+Trump/Pence
(R)
|
1,255,776 |
58.46% |
Biden/Harris
(D)
|
856,034
|
39.85%
|
Jorgensen/Cohen
(L)
|
21,645
|
1.01%
|
Others (10)
|
14,607
|
0.68%
|
|
2,148,062
|
|
|
|
|
Plurality:
399,742 votes
18.61
percentage points |
|
|
|
|
|
|
Nov. 3,
2020 U.S. Senate
(Blanket
Primary)
+Bill Cassidy (R) i
|
1,228,908
|
59.32%
|
Adrian Perkins (D)
|
394,049
|
19.02%
|
| D.
"Champ" Edwards (D) |
229,814
|
11.09%
|
Antoine Pierce (D)
|
55,710
|
2.69%
|
Dustin
Murphy (R)
|
38,383
|
1.85%
|
David
Drew Knight (D)
|
36,962
|
1.78%
|
Others
(9)
|
87,717
|
<
1%
each
|
|
2,071,543
|
|
Plurality: 834,859 votes
40.30 percentage points
|
|
[no
literature obtained] |
[no
literature]
|
|
| 2019
|
|
|
|
|
Nov.
16, 2019 Governor Runoff
+John Bel Edwards (D) i
|
774,498
|
51.33%
|
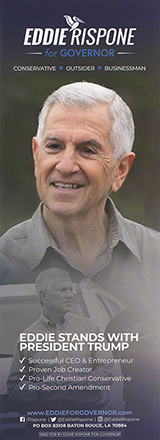
Eddie Rispone (R)
|
734,286
|
48.67%
|
|
1,508,784
|
|
Plurality: 40,212 votes
2.66 percentage points
|
|
 |
 |
|
| 2016
|
|
|
|
|
Dec.
10, 2016 U.S. Senate Runoff
+John Kennedy (R)
|
536,191
|
60.65%
|
Foster Campbell (D)
|
347,816
|
39.35%
|
|
884,007
|
|
Plurality 188,375
votes
21.30 percentage
points
|
|
 |
 |
|
|
|
|
|
|
Nov.
8, 2016 President
+Trump/Pence (R)
|
1,178,638
|
58.09%
|
Clinton/Kaine
(D)
|
780,154
|
38.45%
|
Johnson/Weld
(L)
|
37,978
|
1.87%
|
Stein/Baraka
(G)
|
14,031
|
0.69%
|
| McMullin/Johnson
(CCS) |
8,547
|
0.42%
|
Others
(8)
|
9,684
|
0.48% |
|
2,029,032
|
|
|
|
|
Plurality:
398,484 votes
19.64
percentage points
|
|
| 2015
|
|
|
|
|
Nov.
21, 2015 Governor Runoff D+
+John Bel Edwards (D)
|
646,924
|
56.11%
|
David Vitter (R)
|
505,940
|
43.89%
|
|
1,152,864
|
|
Plurality: 140,984 votes
12.23 percentage points
|
|
 |
 |
|
| 2014
|
|
|
|
|
Dec.
6, 2014 U.S. Senate Runoff R+
+Bill Cassidy (R)
|
712,379
|
55.93%
|
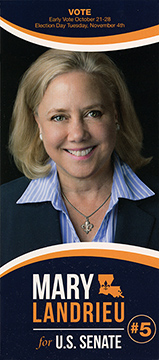
| Mary
Landrieu (D) i
|
561,210
|
44.07%
|
|
1,273,589
|
|
Plurality: 151,169 votes
11.87 percentage
points
|
|
 |
 |
|
| 2012
|
|
|
|
|
Nov.
6, 2012 President
+Romney/Ryan (R)
|
1,152,262
|
57.78%
|
| Obama/Biden
(D) |
809,141
|
40.58%
|
Johnson/Gray
(L)
|
18,157
|
0.91%
|
Stein/Honkala
(G)
|
6,978
|
0.35%
|
Others
(7)
|
7,527
|
0.38%
|
|
1,994,065
|
|
|
|
|
Plurality: 343,121 votes
17.20 percentage
points |
|
| 2011
|
|
|
|
|
Oct.
22, 2011 Governor
(Blanket
Primary)
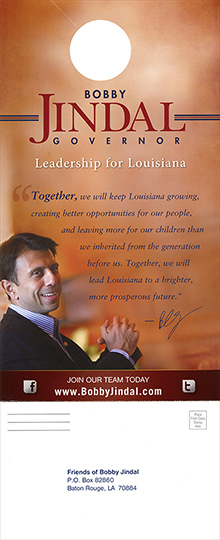
+Bobby Jindal (R)
i
|
673,239
|
65.80%
|
| Tara Hollis
(D) |
182,925
|
17.88%
|
Cary J.
Deaton (D)
|
50,071
|
4.89%
|
Ivo
"Trey" Roberts (D)
|
33,280
|
3.25%
|
David
Blanchard (NP)
|
26,705
|
2.61%
|
"Niki
Bird"Papazoglakis(D)
|
21,885
|
2.14%
|
Others
(4)
|
35,058
|
3.43%
|
|
1,023,163
|
|
Plurality: 490,314 votes
47.92 percentage
points |
|
[no literature
obtained] |
 |
|
| 2010
|
|
|
|
|
Nov.
2, 2010 U.S. Senate
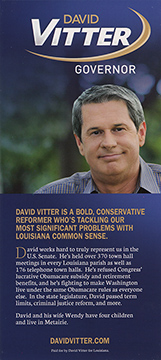
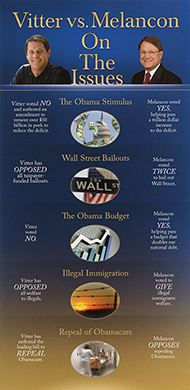
+David Vitter (R)
i
|
715,415
|
56.55%
|
| Charlie Melançon (D)
|
476,572
|
37.67%
|
Randall
Todd Hayes (L)
|
13,957
|
1.10%
|
Others (9
at <1% each)
|
59,050
|
4.67%
|
|
1,264,994
|
|
Plurality: 238,843 votes
18.88 percentage
points |
|
 |
 |
 |
|
|
|
|
|
|