|
2022 |
|
Democrats |
Republicans |
Third
Party/Independent
|
Nov. 8,
2022 Governor
+Laura Kelly
David Toland (D) i
|
499,849
|
49.54%
|
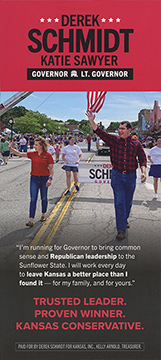
Derek Schmidt
Katie Sawyer (R)
|
477,591
|
47.31%
|
Dennis
Pyle
Kathleen Garrison (I)
|
20,452
|
2.03%
|
Seth
Cordell
Evan Laudick-Gains (L)
|
11,106
|
1.10%
|
|
1,008,998
|
|
Plurality: 22,258 votes
2.21
percentage points
|
|
 |
 |
|
|
|
|
|
|
Nov. 3,
2020 U.S. Senate
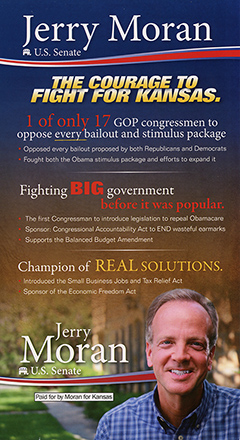
+Jerry Moran (R) i
|
602,976
|
60.00%
|
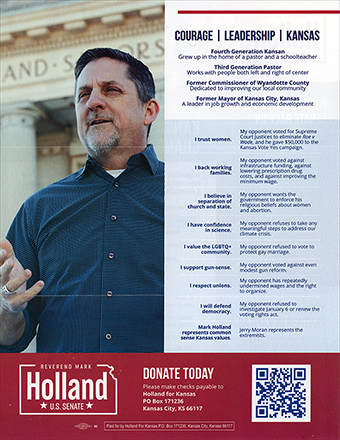
Mark R. Holland (D)
|
372,214
|
37.04%
|
| David
G. Graham (L) |
29,766
|
2.96%
|
|
1,004,956
|
|
Plurality: 230,762 votes
22.96 percentage points
|
|
 |
 |
|
|
2020 |
|
|
|
|
Nov
3, 2020 President
| +Trump/Pence
(R) |
771,406 |
56.21% |
Biden/Harris
(D)
|
570,323
|
41.56%
|
Jorgensen/Cohen
(L)
|
30,574
|
2.23%
|
|
1,372,303 |
|
|
|
|
Plurality:
201,083 votes
14.65 percentage points
|
|
|
|
|
|
|
Nov. 3,
2020 U.S. Senate
+Roger Marshall
(R)
|
727,962
|
53.22%
|
Barbara Bollier (D)
|
571,530
|
45.15%
|
| Jason
Buckley (L) |
68,263
|
4.99%
|
|
1,367,755
|
|
Plurality: 156,432 votes
8.07 percentage points
|
|
 |

|
|
| 2018
|
|
|
|
|
Nov.
6, 2018 Governor D+
+Laura
Kelly
Lynn Rogers (D)
|
506,727
|
48.01%
|
Kris
Kobach
Wink Hartman (R)
|
453,645
|
42.98%
|
Greg
Orman
John Doll (I)
|
68,590
|
6.50%
|
Jeff
Caldwell
Mary Gerit (L)
|
20,020
|
1.90%
|
Rick
Kloos
Nathaniel Kloos (I)
|
6,584
|
0.62%
|
|
1,055,566
|
|
Plurality: 53,082 votes
5.03 percentage points
|
|
 |
 |
   |
| 2016
|
|
|
|
|
Nov.
8, 2016 President
| +Trump/Pence
(R) |
671,018 |
56.65% |
Clinton/Kaine
(D)
|
427,005
|
36.05%
|
Johnson/Weld (L)
|
55,406
|
4.68%
|
Stein/Baraka
(i.)
|
23,506
|
1.98%
|
McMulllin
(w/in)
|
6,520
|
0.55%
|
| 20 other
write-ins |
947
|
0.07%
|
|
1,184,402
|
|
|
|
|
Plurality: 244,013 votes
20.60 percentage points
|
|
|
|
|
|
|
Nov.
8, 2016 U.S. Senate
+Jerry Moran (R) i
|
|
62.18% |
Patrick Wiesner (D)
|
|
32.24%
|
| Robert
D. Garrard (L) |
65,760
|
5.58%
|
DJ Smith
|
46
|
|
|
1,177,922
|
|
Plurality 353,636
votes
29.94
percentage points
|
|
 |
 |
|
| 2014
|
|
|
|
|
Nov.
4, 2014 Governor
+Sam Brownback
Jeff Colyer (R) i
|
433,196
|
49.82%
|
Paul Davis
Jill Docking (D)
|
401,100
|
46.12%
|
Keen
A. Umbehr
Josh Umbehr (L) |
35,206
|
4.05%
|
|
869,502
|
|
Plurality: 32,096 votes
3.69 percentage points
|
|
 |
 |
 |
|
|
|
|
|
Nov.
4, 2014 U.S. Senate
+Pat Roberts (R)
|
460,350
|
53.15%
|
Greg Orman (I)
|
368,372
|
42.53%
|
| Randall
Batson (L) |
37,469
|
4.33%
|
|
866,191
|
|
Plurality: 91,978 votes
10.62 percentage points |
|
[Democratic
nominee
Chad Taylor
withdrew Sept. 3] |
 |
 |
| 2012
|
|
|
|
|
Nov.
6, 2012 President
+Romney/Ryan (R)
|
692,634
|
59.71%
|
Obama/Biden (D)
|
440,726
|
37.99%
|
| Johnson/Gray
(L) |
20,456
|
1.76%
|
Baldwin/Martin
(Ref.)
|
5,017
|
0.43%
|
Jill
Stein (w/in)
|
714
|
0.06%
|
other
write-ins
|
424
|
0.03%
|
|
1,159,971
|
|
|
|
|
Plurality: 251,908 votes
21.72 percentage points |
|
| 2010
|
|
|
|
|
Nov.
2, 2010 Governor R+
+Sam Brownback
Jeff Colyer (R)
|
530,760
|
63.28%
|
Tom Holland
Kelly Kultala (D)
|
270,166
|
32.21%
|
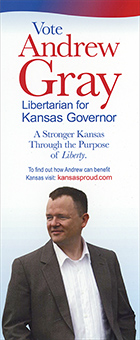
Andrew
P. Gray
Stacey Davis (L) |
22,460
|
2.68%
|
Ken W.
Cannon
Dan Faubion (F)
|
15,397
|
1.84%
|
Heath C.
Norris (w/in
|
7
|
|
|
869,502
|
|
Plurality: 260,594 votes
31.07 percentage points
|
|
 |
 |
 |
|
|
|
|
|
Nov.
2, 2010 U.S. Senate
+Jerry Moran (R)
|
587,175
|
70.09%
|
Lisa Johnston (D)
|
220,971
|
26.38%
|
| Michael
Wm. Dann (L) |
17,922
|
2.14%
|
Joe K.
Bellis (F)
|
11,624
|
1.39%
|
|
837,692
|
|
Plurality:386,204 votes
43.72 percentage points |
|
 |
 |
|
| |
|
|
|
|
|