2022
|
|
Democrats |
Republicans |
Third
Party/Independent
|
Nov. 8,
2022 Governor
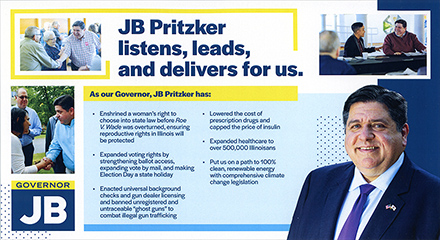
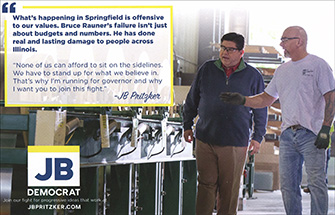
+JB Pritzker (D) i
|
2,253,748
|
54.91%
|
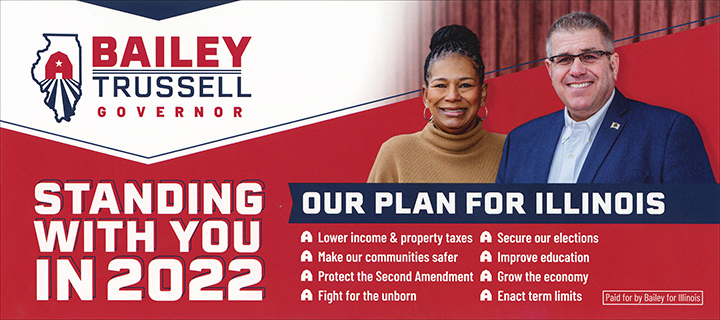
Darren Bailey (R)
|
1,739,095
|
42.37%
|
| Scott
Schluter (L) |
111,712
|
2.72%
|
others (4)
|
81
|
|
|
4,104,636
|
|
Plurality: 514,653 votes
12.54 percentage points
|
|
 |
 |
|
|
|
|
|
|
Nov. 8,
2022 U.S. Senate
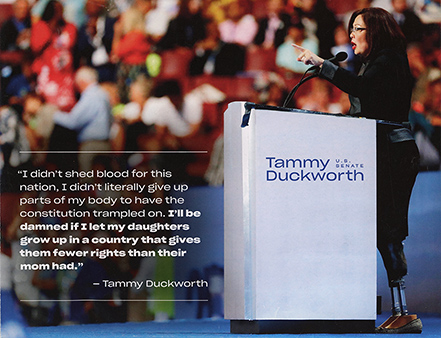
+Tammy Duckworth
(D) i
|
2,329,136
|
56.82%
|
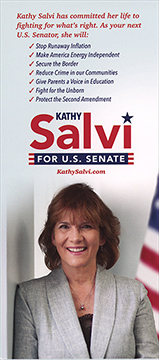
Kathy Salvi (R)
|
1,701,055
|
41.50%
|
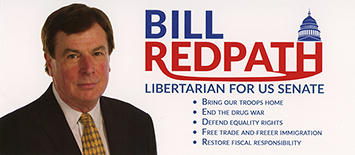
Bill Redpath (L)
|
68,671
|
1.68%
|
others (2)
|
34
|
|
|
4,098,896
|
|
Plurality: 628,081 votes
15.32 percentage points
|
|
 |
 |
 |
2020
|
|
|
|
|
Nov
3, 2020 President
+Biden/Harris
(D)
|
3,471,915
|
57.54%
|
Trump/Pence
(R)
|
2,446,891
|
40.55%
|
Jorgensen/Cohen
(L)
|
66,544
|
1.10%
|
Hawkins/Walker
(G)
|
30,494
|
0.51%
|
Carroll/Patel
(ASP)
|
9,548
|
0.16%
|
| La
Riva/Peltier (PSL) |
8,046
|
0.13%
|
others
|
306
|
|
|
6,033,744
|
|
|
|
Plurality: 1,025,024
votes
16.99
percentage points |
|
|
|
|
|
|
|
Nov. 3,
2020 U.S. Senate
+Dick Durbin (D) i
|
3,278,930
|
54.93%
|
Mark Curran (R)
|
2,319,870
|
38.87%
|
| Willie
Wilson (I) |
237,699
|
3.98%
|
Danny Malouf (L)
|
75,673
|
1.27%
|
David Black (G)
|
56,711
|
0.95%
|
others
|
18
|
|
|
5,968,901
|
|
Plurality: 959,060 votes
16.06 percentage points
|
|
 |
 |
|
| 2018
|
|
|
|
|
Nov.
6, 2018 Governor D+
+JB
Pritzker (D)
|
2,479,746
|
54.53%
|
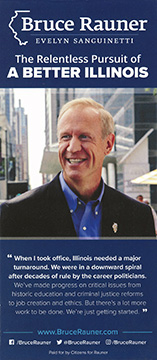
Bruce
Rauner (R) i
|
1,765,751
|
38.83%
|
William
"Sam" McCann (C)
|
192,527
|
4.23%
|
Grayson
Kash Jackson (L)
|
109,518
|
2.41%
|
write-ins
(9)
|
115
|
|
|
4,547,657
|
|
Plurality: 713,995 votes
15.70 percentage points
|
|
 |
 |
|
| 2016
|
|
|
|
|
Nov.
8, 2016 President
+Clinton/Kaine
(D)
|
3,090,729
|
(55.83)
|
Trump/Pence
(R)
|
2,146,015
|
(38.76)
|
Johnson/Weld (L)
|
209,596
|
(3.79)
|
Stein/Baraka
(G)
|
76,802
|
(1.39)
|
write-ins -
27*
|
13,282
|
(0.24)
|
| Total........5,536,424 |
|
|
*Of the write-in votes, Evan
McMullin obtained 11,655 (0.2%), Darrell
Castle 1,138 and the other 25 candidates 489
votes. |
|
Plurality:
944,714 votes
17.07
percentage points
|
|
|
|
|
|
|
|
Nov.
8, 2016 U.S. Senate D+
+Tammy Duckworth (D)
|
3,012,940 |
54.86%
|
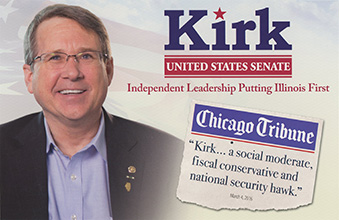
| Mark Kirk (R) i |
2,184,692 |
39.78%
|
Kent McMillen (L)
|
175,988 |
3.20%
|
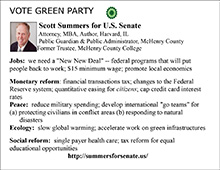
Scott
Summers (G)
|
117,619 |
2.14%
|
others
(6)
|
639
|
|
|
5,491,878 |
|
Plurality: 828,248 votes
15.08 percentage
points
|
|

|
 |

 |
2014
|
|
|
|
|
Nov.
4, 2014 Governor R+
+Bruce Rauner (R)
|
1,823,627
|
50.27%
|
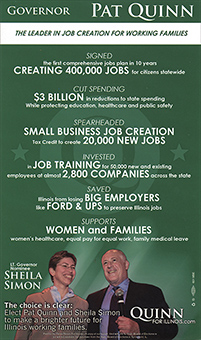
Pat Quinn (D)
i
|
1,681,343
|
46.35%
|
| Chad
Grimm (L) |
121,534
|
3.35%
|
others (6)
|
1,186
|
|
|
3,627,690
|
|
Plurality: 142,284 votes
3.92 percentage
points
|
|
 |
 |
|
|
|
|
|
|
Nov.
4, 2014 U.S. Senate
+Dick Durbin (D) i
|
1,929,637
|
53.55%
|
Jim Oberweis (R)
|
1,538,522
|
42.69%
|
| Sharon
Hansen (L) |
135,316
|
3.76%
|
others (3)
|
44
|
|
|
3,603,519
|
|
Plurality: 391,115 votes
10.68 percentage
points |
|
 |
 |
|
| 2012
|
|
|
|
|
Nov.
6, 2012 President
+Obama/Biden (D)
|
3,019,512
|
57.60%
|
Romney/Ryan (R)
|
2,135,216
|
40.73%
|
| Johnson/Gray (L) |
56,229 |
1.07% |
Stein/Hawkins
(G)
|
30,222
|
0.58%
|
write-ins
|
835
|
|
|
5,242,014
|
|
|
|
Plurality: 884,296 votes
16.87 percentage
points |
|
|
2010
|
|
|
|
|
Nov.
2, 2010 Governor
+Pat Quinn (D) i
|
1,745,219
|
46.79%
|
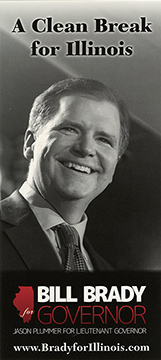
Bill Brady (R)
|
1,713,385
|
45.94%
|
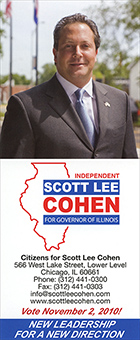
| Scott
Lee Cohen (I) |
135,705
|
3.64%
|
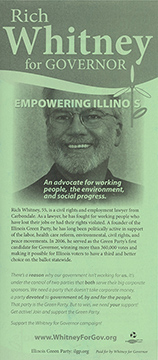
Rich Whitney (G)
|
100,756
|
2.70%
|
Lex Green
(L)
|
34,681
|
0.93%
|
others
|
243
|
|
|
3,729,989
|
|
Plurality: 31,834 votes
0.85 percentage points
|
|
 |
 |
  |
|
|
|
|
|
Nov.
2, 2010 U.S. Senate R+
special election
and six-year term election
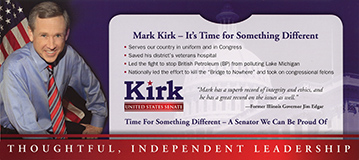
+Mark Kirk (R)
|
1,778,698
|
48.01%
|
Alexi Giannoulias (D)
|
1,719,478
|
46.42%
|
| LeAlan
M. Jones (G) |
117,914
|
3.18%
|
Mike
Labno (L)
|
87,247
|
2.36%
|
write-ins (9)
|
1,136
|
|
|
3,704,473
|
|
Plurality: 59,220 votes
1.59 percentage points |
|
 |
 |
|
|
|
|
|
|
|