2022
|
|
Democrats |
Republicans |
Third
Party/Independent
|
Nov. 8,
2022 Governor
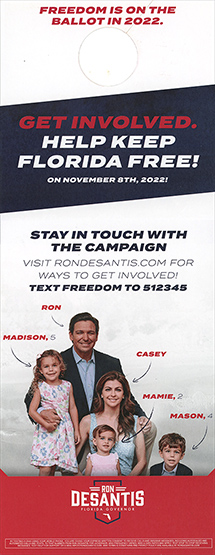
+Ron
DeSantis/
Jeanette Nuñez (R) i
|
4,614,210
|
59.37%
|
Charlie Crist (D)/
Karla Hernández-Mats
(D) |
3,106,313
|
39.97%
|
Jackie Gimenez/
Kyle Gibson (NPA)
|
31,577
|
0.41%
|
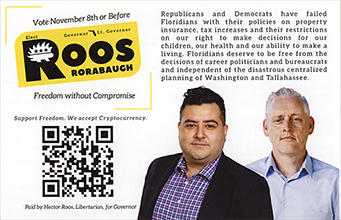
Hector Roos/
Jerry Rorabaugh (L) |
19,299
|
0.25%
|
|
7,771,399
|
|
Plurality: 1,507,897 votes
19.40 percentage
points
|
|
 |
 |
 |
|
|
|
|
|
Nov. 8,
2022 U.S. Senate
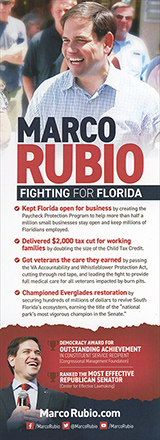
| +Marco
Rubio (R) i
|
4,474,847
|
57.68%
|
Val
Demings (D)
|
3,201,522
|
41.27%
|
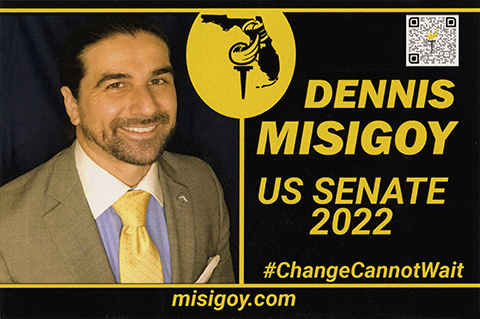
Dennis
Misigoy (L)
|
32,177
|
0.41%
|
Steven B.
Grant (NPA)
|
31,816
|
0.41%
|
Tuan
TQ Nguyen (NPA)
|
17,385
|
0.22%
|
write-ins
(4)
|
267
|
|
|
7,758,014
|
|
Plurality: 1,273,325
16.41 percentage
points
|
|
 |
 |
 |
2020
|
|
|
|
|
Nov
3, 2020 President
| +Trump/Pence
(R)
|
5,668,731
|
51.21%
|
Biden/Harris
(D)
|
5,297,045
|
47.85%
|
Jorgensen/Cohen (L)
|
70,324
|
0.64%
|
| Hawkins/Walker (G) |
14,721 |
0.13% |
La
Riva/Freeman (PSL)
|
7,712
|
0.07%
|
| De La
Fuente/Richardson (Ref.) |
5,966
|
0.05%
|
Blankenship/Mohr
(CPF)
|
3,902
|
0.04%
|
write-ins
(6)
|
1,055
|
0.01%
|
|
11,069,456 |
|
|
|
|
Plurality:
371,686 votes
3.36 percentage
points
|
|
| 2018
|
|
|
|
|
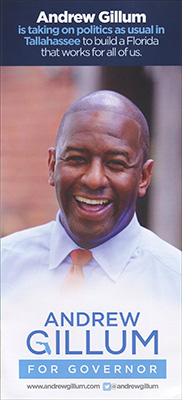
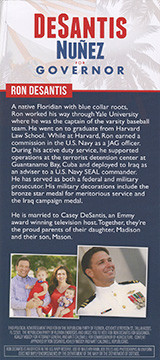
Nov. 6,
2018 Governor
+Ron
DeSantis/
Jeanette Nuñez (R)
|
4,076,186
|
49.59%
|
Andrew
Gillum/
Chris King (D)
|
4,043,723
|
49.19%
|
D.Richardson/
Nancy Argenziano (Ref.)
|
47,140
|
0.57%
|
Kyle
Gibson/Ellen Wilds (NPA)
|
24,310
|
0.30%
|
Ryan
Foley/John Tutton (NPA)
|
14,630
|
0.18%
|
Bruce
Stanley/
Ryan McJury (NPA)
|
14,505
|
0.18%
|
write-ins
(2)
|
67
|
|
|
8,220,561
|
|
Plurality: 32,463 votes
0.40 percentage
points
|
|
 |
 |
 |
|
|
|
|
|
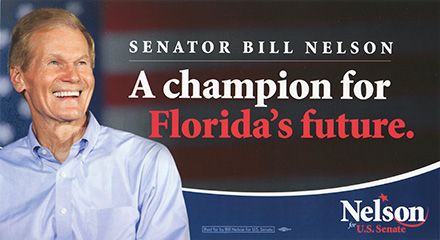
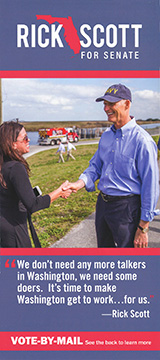
Nov.
6, 2018 U.S. Senate R+
+Rick Scott (R)
|
4,099,505
|
50.05%
|
Bill Nelson (D) i
|
4,089,472
|
49.93%
|
write-ins
(5)
|
1,028
|
0.02%
|
|
8,190,005
|
|
Plurality: 10,033 votes
0.12 percentage
points
|
|
 |
 |
|
| 2016
|
|
|
|
|
Nov.
8, 2016 President
+Trump/Pence
(R)
|
4,617,886
|
49.02%
|
Clinton/Kaine
(D)
|
4,504,975
|
47.82%
|
Johnson/Weld (L)
|
207,043
|
2.20%
|
| Stein/Baraka (G) |
64,399 |
0.68% |
Castle/Bradley
(CPF)
|
16,475
|
0.17%
|
De La
Fuente/Steinberg
(Ref.)
|
9,108
|
0.10%
|
write-ins
(6)
|
153
|
-
|
|
9,420,039
|
|
|
|
|
Plurality: 112,911 votes
1.20 percentage
points
|
|
|
|
|
|
|
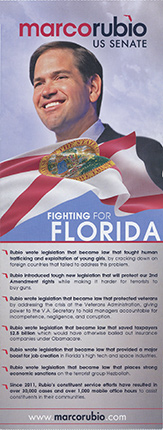
Nov.
8, 2016 U.S. Senate
+Marco Rubio (R) i
|
4,835,191 |
51.98%
|
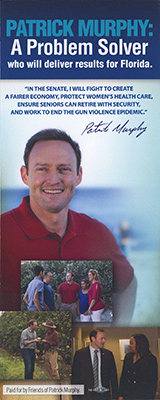
Patrick Murphy (D)
|
4,122,088 |
44.31%
|
Paul Stanton (LPF)
|
196,956 |
2.12%
|
Bruce
Nathan (NPA)
|
52,451
|
0.56%
|
Tony Khoury
(NPA)
|
45,820
|
0.49%
|
Steve
Machat (NPA)
|
26,918
|
0.29%
|
Basil E.
Dalack (NPA)
|
22,236
|
0.24%
|
write-ins
|
180
|
|
|
9,301,840
|
|
Plurality 713,103
votes
7.67
percentage points
|
|
 |
 |
|
| 2014
|
|
|
|
|
Nov.
4, 2014 Governor
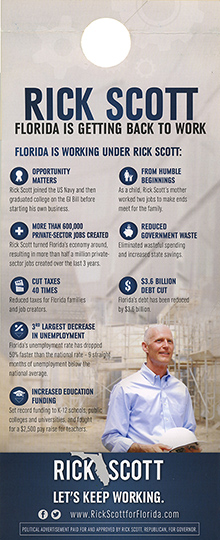
+Rick
Scott/
Carlos Lopez-Cantera (R) i
|
2,865,343
|
48.14%
|
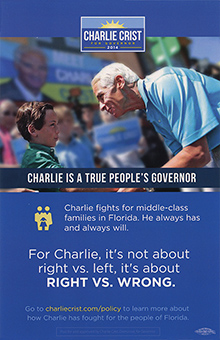
Charlie
Crist/
Annette Taddeo (D)
|
2,801,198
|
47.07%
|
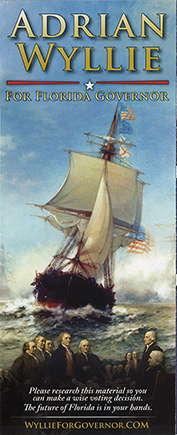
Adrian
Wyllie/Greg Roe (LPF)
|
223,356
|
3.75%
|
Glenn Burkett/
Jose Augusto Matos (NPA)
|
41,341
|
0.69%
|
Farid
Khavari/
Lateresa A. Jones (NPA)
|
20,186
|
0.34%
|
write-ins
(5)
|
137
|
|
|
5,951,561
|
|
Plurality: 64,145 votes
1.08 percentage
points
|
|
 |
 |
 |
| 2012
|
|
|
|
|
Nov.
6, 2012 President
| +Obama/Biden (D)
|
4,237,756
|
50.01%
|
Romney/Ryan (R)
|
4,163,447
|
49.13%
|
Johnson/Gray
(L)
|
44,726
|
0.53%
|
Stein/Honkala
(G)
|
8,947
|
0.11%
|
Barr/Sheehan
(PFP
|
8,154
|
0.10%
|
7 others
with <0.10%
|
11,104
|
0.13%
|
write-ins
(6)
|
45
|
|
|
8,474,179
|
|
|
|
Plurality: 74,309 votes
0.88 percentage points
|
|
|
|
|
|
|
|
Nov.
6, 2012 U.S. Senate
+Bill
Nelson (D) i
|
4,523,451
|
55.23%
|
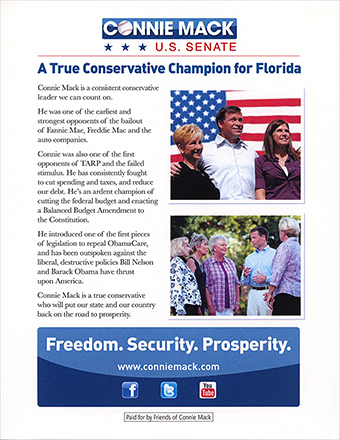
Connie
Mack (R)
|
3,458,267
|
42.23%
|
Bill Gaylor
(NPA)
|
126,079
|
1.54%
|
Chris Borgia (NPA)
|
82,089
|
1.000%
|
write-ins
(5)
|
60
|
|
|
8,189,946
|
|
Plurality: 1,065,184 votes
13.00 percentage points
|
|
 |
 |
|
| 2010
|
|
|
|
|
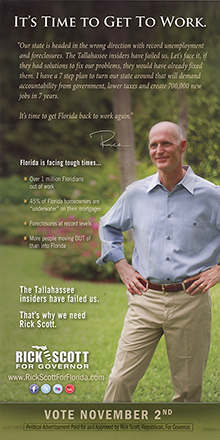
Nov.
2, 2010 Governor R+
+Rick Scott/
Jennifer Carroll (R)
|
2,619,335
|
48.87%
|
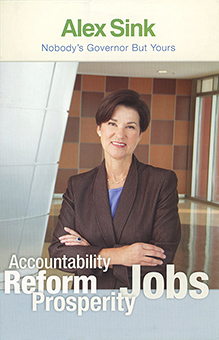
Alex Sink/Rod Smith (D)
|
2,557,785
|
47.72%
|
Peter
Allen/John Zanni (IDP)
|
123,831
|
2.31%
|
4 others
(NPA) plus w/in
|
58,784
|
1.10%
|
|
5,359,735
|
|
Plurality: 61,550 votes
1.15 percentage points |
|
|
 |
|
|
|
|
|
|
Nov.
2, 2010 U.S. Senate
+Marco
Rubio (R)
|
2,645,743
|
48.89%
|
Charlie
Crist (NPA)
|
1,607,549
|
29.71%
|
Kendrick
Meek (D)
|
1,092,936
|
20.20%
|
Alexander Snitker (L)
|
24,850
|
0.46%
|
others
(7)
|
39,920
|
0.74%
|
write-ins
(7)
|
108
|
|
|
5,411,106
|
|
Plurality: 1,038,194 votes
19.19 percentage points
|
|
 |
 |
 |
|