|
2022 |
|
Democrats |
Republicans |
Third
Party/Independent
|
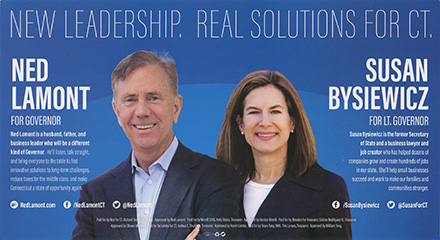
Nov. 8, 2022 Governor
| +Ned
Lamont/Susan Bysiewicz (D,WF,GF)
i
|
710,186
|
55.97%
|
Bob
Stefanowski/
Laura Devlin (R)
|
546,209
|
43.05%
|
Rob
Hotaling/
Chip Beckett (ICT)
|
12,400
|
0.98%
|
Michelle Louise Bicking/
C.Martineau (w/in)
|
98
|
|
|
1,268,893
|
|
Plurality: 163,977 votes
12.63 percentage
points
|
|
 |
 |
 |
|
|
|
|
|
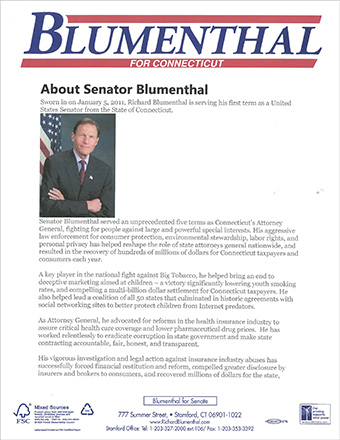
Nov.
8, 2022 U.S. Senate
+Richard
Blumenthal
(D,WF) i
|
723,864
|
57.45%
|
Leora
R. Levy (R)
|
535,943
|
42.54%
|
write-ins
(2)
|
80
|
|
|
1,259,887
|
|
Plurality: 187,921 votes
14.92 percentage
points
|
|
 |
 |
|
|
2020 |
|
|
|
|
Nov
3, 2020 President
+Biden/Harris
(D)
|
1,080,831
|
59.26%
|
Trump/Pence
(R)
|
714,717
|
39.19%
|
Jorgensen/Cohen
(L)
|
20,230
|
1.11%
|
Hawkins/Walker
(G)
|
7,538
|
0.41%
|
| w/ins
(10) |
541
|
|
|
1,823,857
|
|
|
|
Plurality:
366,114 votes
20.07 percentage points
|
|
|
| 2018
|
|
|
|
|
Nov.
6, 2018 Governor
+Ned
Lamont/
Susan Bysiewicz (D,WF)
|
694,510
|
49.37%
|
Bob
Stefanowski/
Joe Markley (R,I)
|
650,138
|
46.21%
|
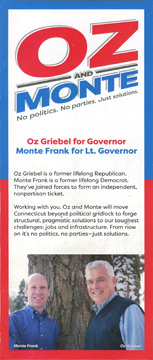
Oz
Griebel/
Monte Frank (GFCT)
|
54,741
|
3.89%
|
R.Hanscomb/
Jeffrey Thibeault (L)
|
6,086
|
0.43%
|
M.S.Greenstein/
J.Demitrus (Amigo) |
1,254
|
0.09%
|
Whitnum/Wyatt
(w/in)
|
74
|
|
|
1,406,803
|
|
Plurality: 44,372 votes
3.16 percentage
points
|
|
 |
 |
 |
|
|
|
|
|
Nov.
6, 2018 U.S. Senate
+Chris Murphy (D, WF) i
|
825,579
|
59.53%
|
Matthew Corey (R)
|
545,717
|
39.35%
|
Richard Lion (L)
|
8,838
|
0.64%
|
Jeff
Russell (G)
|
6,618
|
0.48%
|
w/ins (2)
|
88
|
|
|
1,386,840
|
|
Plurality: 279,862 votes
20.18 percentage
points
|
|
|
|
|
| 2016
|
|
|
|
|
Nov.
8, 2016 President
+Clinton/Kaine
(D)
|
897,572
|
54.57%
|
Trump/Pence
(R)
|
673,215
|
40.93%
|
Johnson/Weld
(L)
|
48,676
|
2.96%
|
Stein/Baraka
(G)
|
22,841
|
1.39%
|
McMullin/Johnson
(w/in)
|
2,108
|
0.13%
|
Castle/Bradley
(w/in)
|
147
|
|
other
w/ins (18)
|
332
|
|
|
1,644,891
|
|
|
|
Plurality:
224,357 votes
13.64 percentage points
|
|
|
|
|
|
|
|
Nov.
8, 2016 U.S. Senate
+Richard Blumenthal (D) i
|
1,008,714
|
63.19% |
Dan Carter (R)
|
552,621
|
34.62%
|
| Richard
Lion (L) |
18,190
|
1.14%
|
| Jeff
Russell (G) |
16,713
|
1.05%
|
write-ins
(2)
|
38
|
|
|
1,596,276
|
|
Plurality: 456,093 votes
28.57 percentage
points
|
|
 |
 |
|
| 2014
|
|
|
|
|
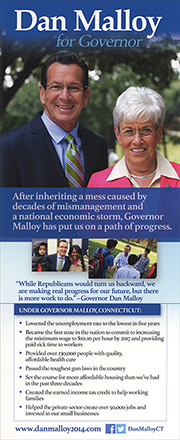
Nov.
4, 2014 Governor
+Dannel
Malloy/
Nancy Wyman (D,WF)
i
|
554,314
|
50.73%
|
Thomas
Foley/
Nancy Somers (R,I)
|
526,295
|
48.16%
|
Joe
Visconti/
C.F. Harris (Pet.)
|
11,456
|
1.05%
|
write-ins
(4)
|
708
|
|
|
1,092,773
|
|
Plurality: 28,019 votes
2.56 percentage points
|
|
 |
 |
|
| 2012
|
|
|
|
|
Nov.
6, 2012 President
+Obama/Biden (D)
|
905,083
|
58.06%
|
Romney/Ryan
(R)
|
634,892
|
40.73%
|
Johnson/Gray
(L)
|
12,580
|
0.81%
|
Anderson/Rodriguez
(I)
|
5,487
|
0.35%
|
Stein/Honkala
(w/in)
|
863
|
|
more
write-ins (5)
|
55
|
|
|
1,558,960
|
|
|
|
Plurality: 270,191 votes
17.33 percentage points |
|
|
|
|
|
|
|
Nov.
6, 2012 U.S. Senate D+
+Chris Murphy (D,WF)
|
828,761
|
54.82%
|
Linda
McMahon (R,I)
|
651,089
|
43.07%
|
Paul
Passarelli (L)
|
25.045
|
1.66%
|
Matthew
Coleman (w/in)
|
6,414
|
0.42%
|
more
write-ins (6)
|
455
|
|
|
1,511,764
|
|
Plurality: 177,672 votes
11.75 percentage points
|
|
 |
 |
|
| 2010
|
|
|
|
|
Nov. 2, 2010 Governor
D+
+Dannel
Malloy/
Nancy Wyman (D,WF)
|
567,278
|
49.50%
|
Tom
Foley/
Mark Boughton (R)
|
560,874
|
48.95%
|
Thomas
E. Marsh/
Cicero B. Booker, Jr. (IP)
|
17,629
|
1.54%
|
write-ins
(2)
|
18
|
|
|
1,145,799
|
|
Plurality: 6,404 votes
0.56 percentage points |
|

|
 |
 |
|
|
|
|
|
Nov. 2, 2010 U.S.
Senate
+Richard Blumenthal (D,WF)
|
636,049
|
55.19%
|
Linda
McMahon
(R)
|
498,341
|
43.24%
|
Warren
B. Mosler (I)
|
11,275
|
0.98%
|
Dr. John
Mertens (L)
|
6,735
|
0.58%
|
|
1,152,391
|
|
Plurality: 137,699 votes
11.94 percentage points
|
|
 |
 |
|
|