
- Main
Page « 2021
Governor Races «
California
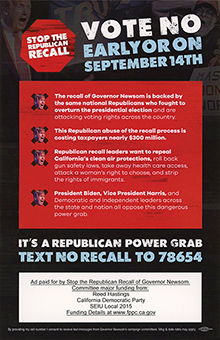
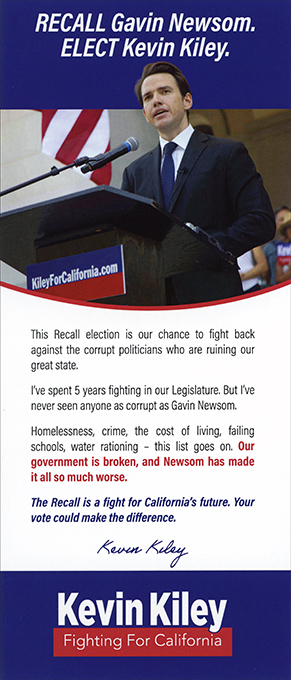
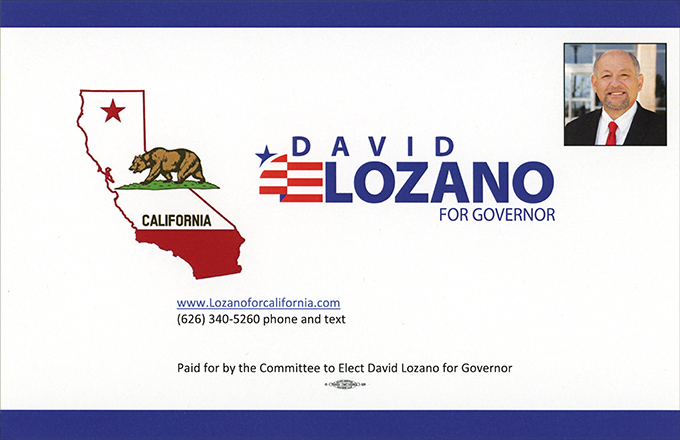
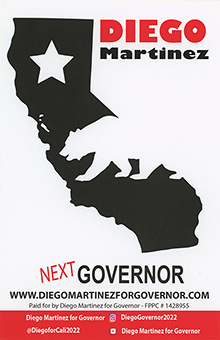
Governor Recall
| CALIFORNIA |
Sept. 14
2021 Governor Recall Election |
|
Shall Gavin
Newsom Be Recalled (Removed) From the Office of Governor?
Total Voters:
12,892,578.
Plurality: 3,046,619 (23.76 percentage points). Gubernatorial Replacement Candidates
Gov. Gavin Newsom secured a resounding win in the Sept. 14 recall election, strengthening his position as he looks ahead to his re-election campaign in 2022. Newsom needed to win more than 50% of the vote to remain as governor; if he had fallen below 50% the top vote-getter would have replaced him as the next governor. Newsom's win was not a surprise. Democrats enjoy a huge registration advantage in the Golden State; the Secretary of State's final report from Aug 30, 2021 showed 22,057,154 registered voters (out of 24,819,858 eligible); of these 10.3 million (46.54%) were registered Democratic, 5.3 million (24.02%) Republican, 5.1 million (23.15%) no party preference and the remainder (a bit more than 6%) other (>). Nevertheless, polls in early August did show the recall vote might be close (>), and the presence of forty-six candidates on the ballot seeking to replace Newsom made for an interesting campaign. "No" won 61.88% of the statewide vote; interestingly, the counties were evenly split—"No" won a majority in 29 counties and "Yes" in 29 counties. |
|


Copyright © 2021 Eric M. Appleman/Democracy in
Action. All rights reserved.![]()